WordPress API requests dashboard
In a headless WordPress setup, the front end (what users see) is separate from the back end (where content is managed). Instead of using traditional WordPress themes and templates, data is retrieved through API calls using either the WordPress REST API or GraphQL API.
However, these API calls can sometimes fail due to server issues, incorrect requests, or other reasons. Additionally, many API calls might not be cached, making the system slower and less efficient as it fetches data from the server every time.
Too many simultaneous API calls can overwhelm the WordPress server, causing crashes or unresponsiveness, often resulting in 5xx HTTP errors such as a 504 (system timeout) error during high traffic periods between the front end and back end.
To provide insights into this layer of your headless WordPress application, we have introduced the WordPress API Requests Dashboard.
This documentation will guide you through the components of this dashboard and explain how to use its filtering and searching functionalities.
Getting started
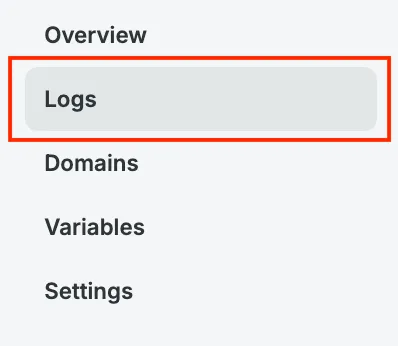
Section titled “Getting started”Navigate to your app environment details and click on the Logs tab in the left-side menu:
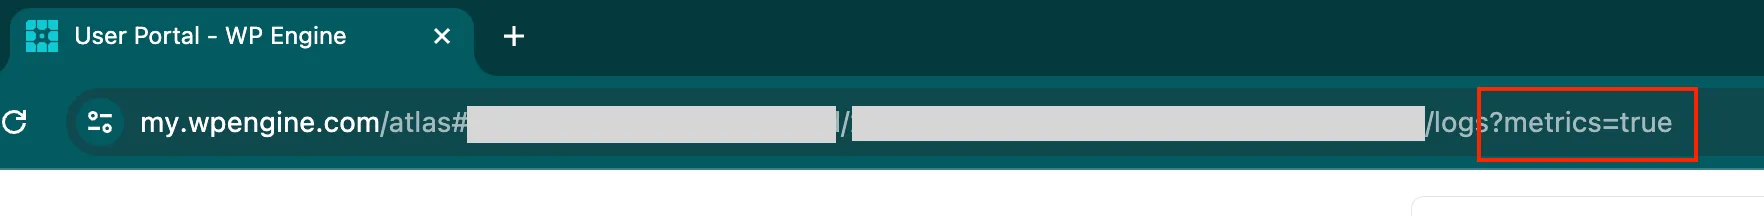
Since this feature is in the alpha phase, it is hidden from most Headless Platform users. To access it, append the ?metrics=true query string to your URL:
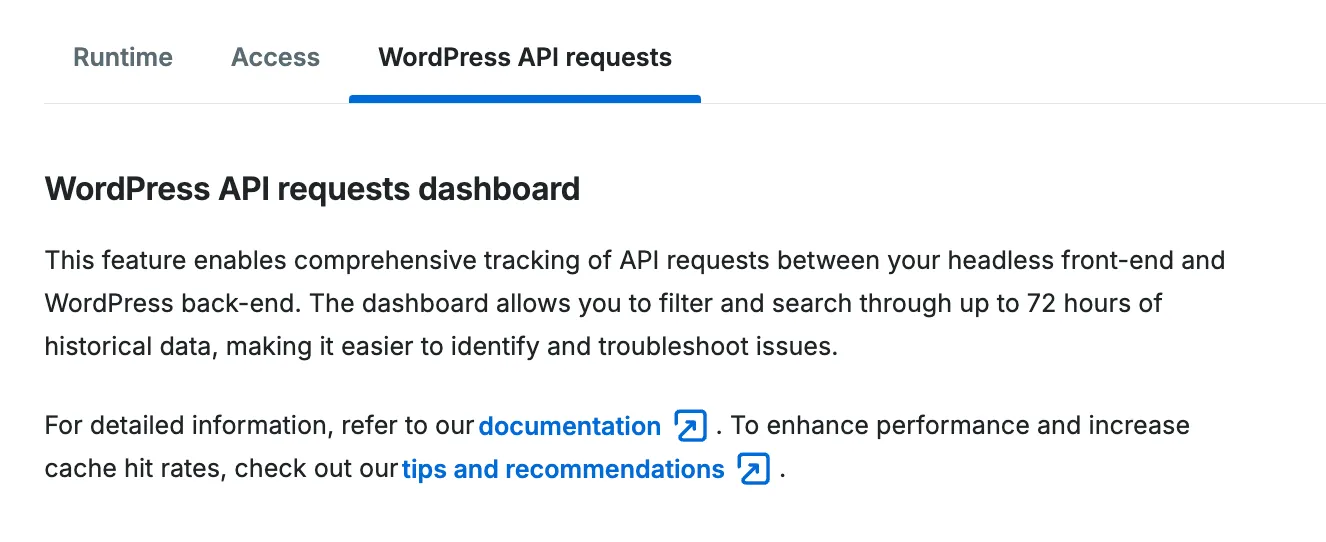
After refreshing the URL, you will see the WordPress API Requests tab next to the Runtime and Access tabs. Click on this tab to open the dashboard:
Charts
Section titled “Charts”Request count and status code
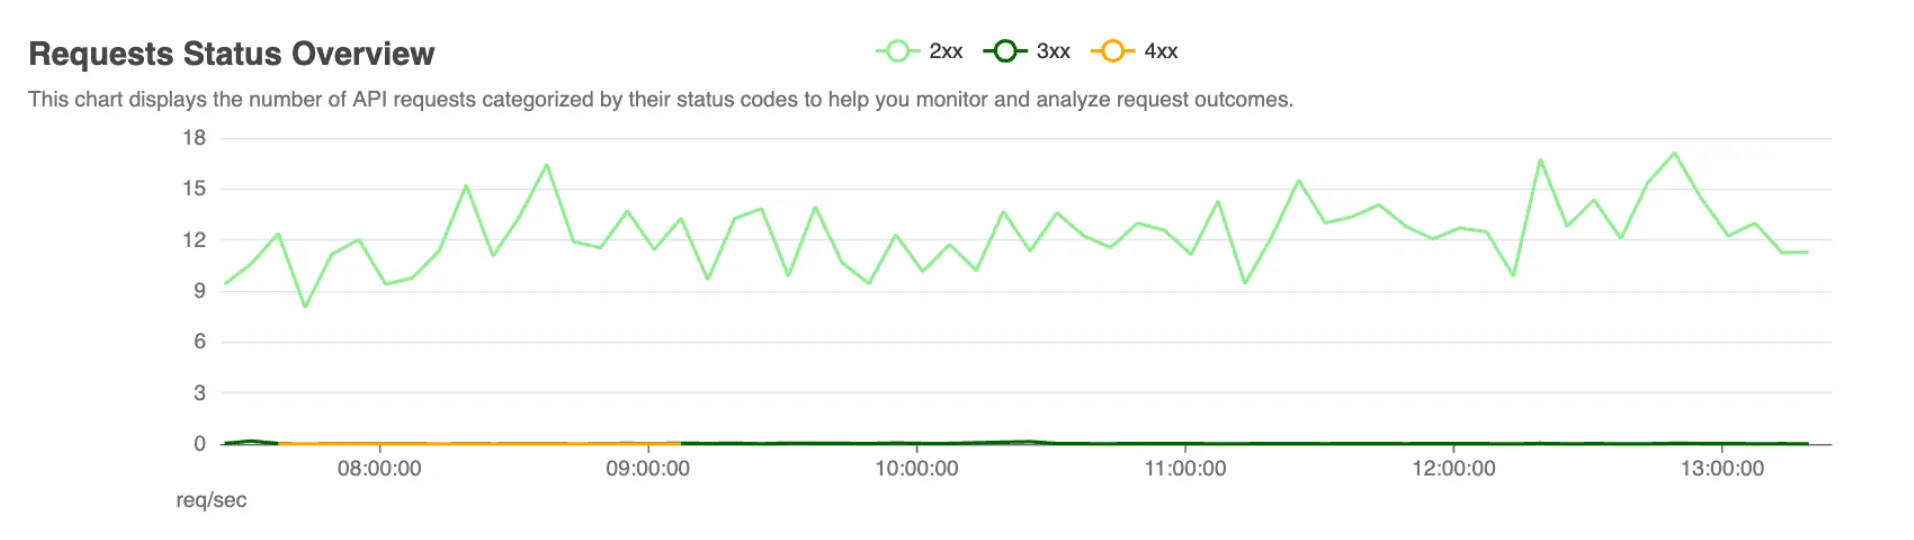
Section titled “Request count and status code”This chart displays the number of requests per second made from your application to WordPress over a specified time period.
Each request is categorized by its HTTP status code, allowing you to see how many requests were successful (2xx HTTP status group), redirected (3xx), resulted in client errors (4xx), or caused server errors (5xx).
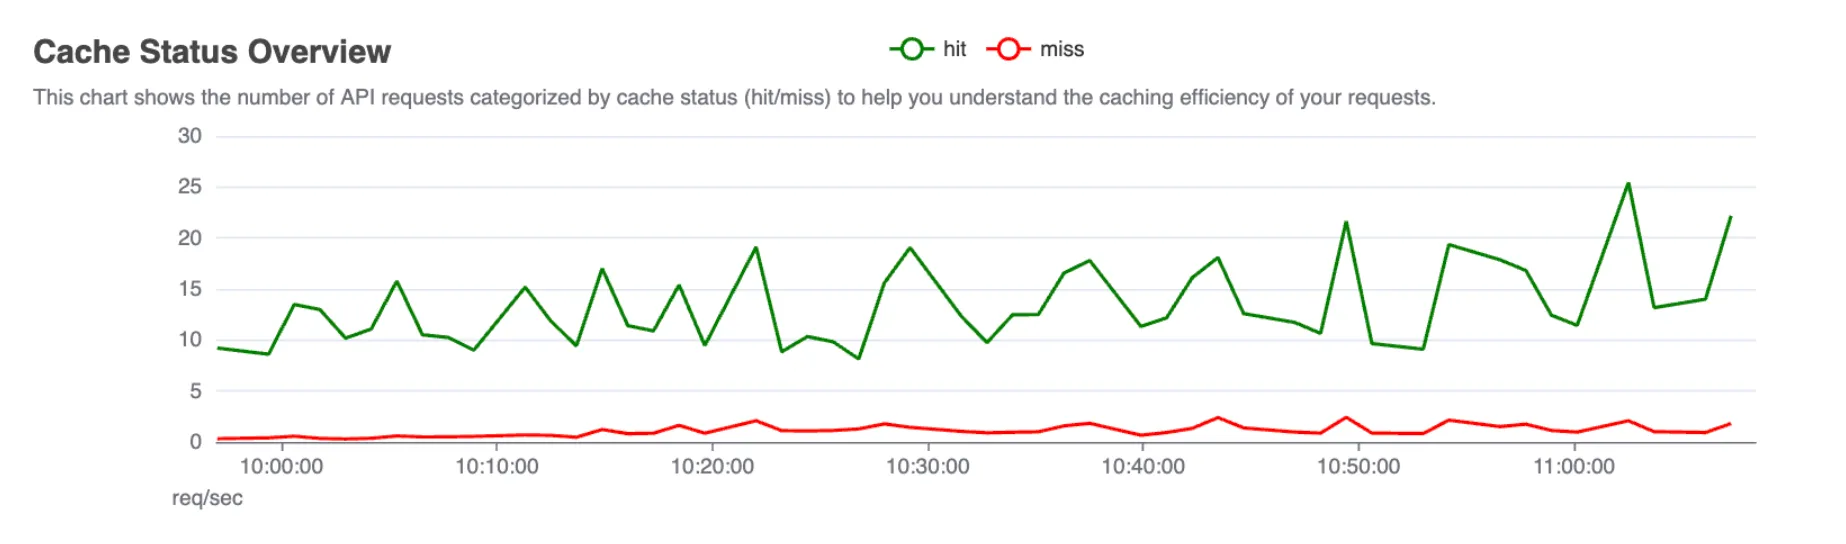
Cache vs. Origin Requests
Section titled “Cache vs. Origin Requests”This chart compares the number of requests served from the cache against those served from the origin (WordPress server).
This helps you understand the efficiency of your caching strategy and identify areas for improvement.
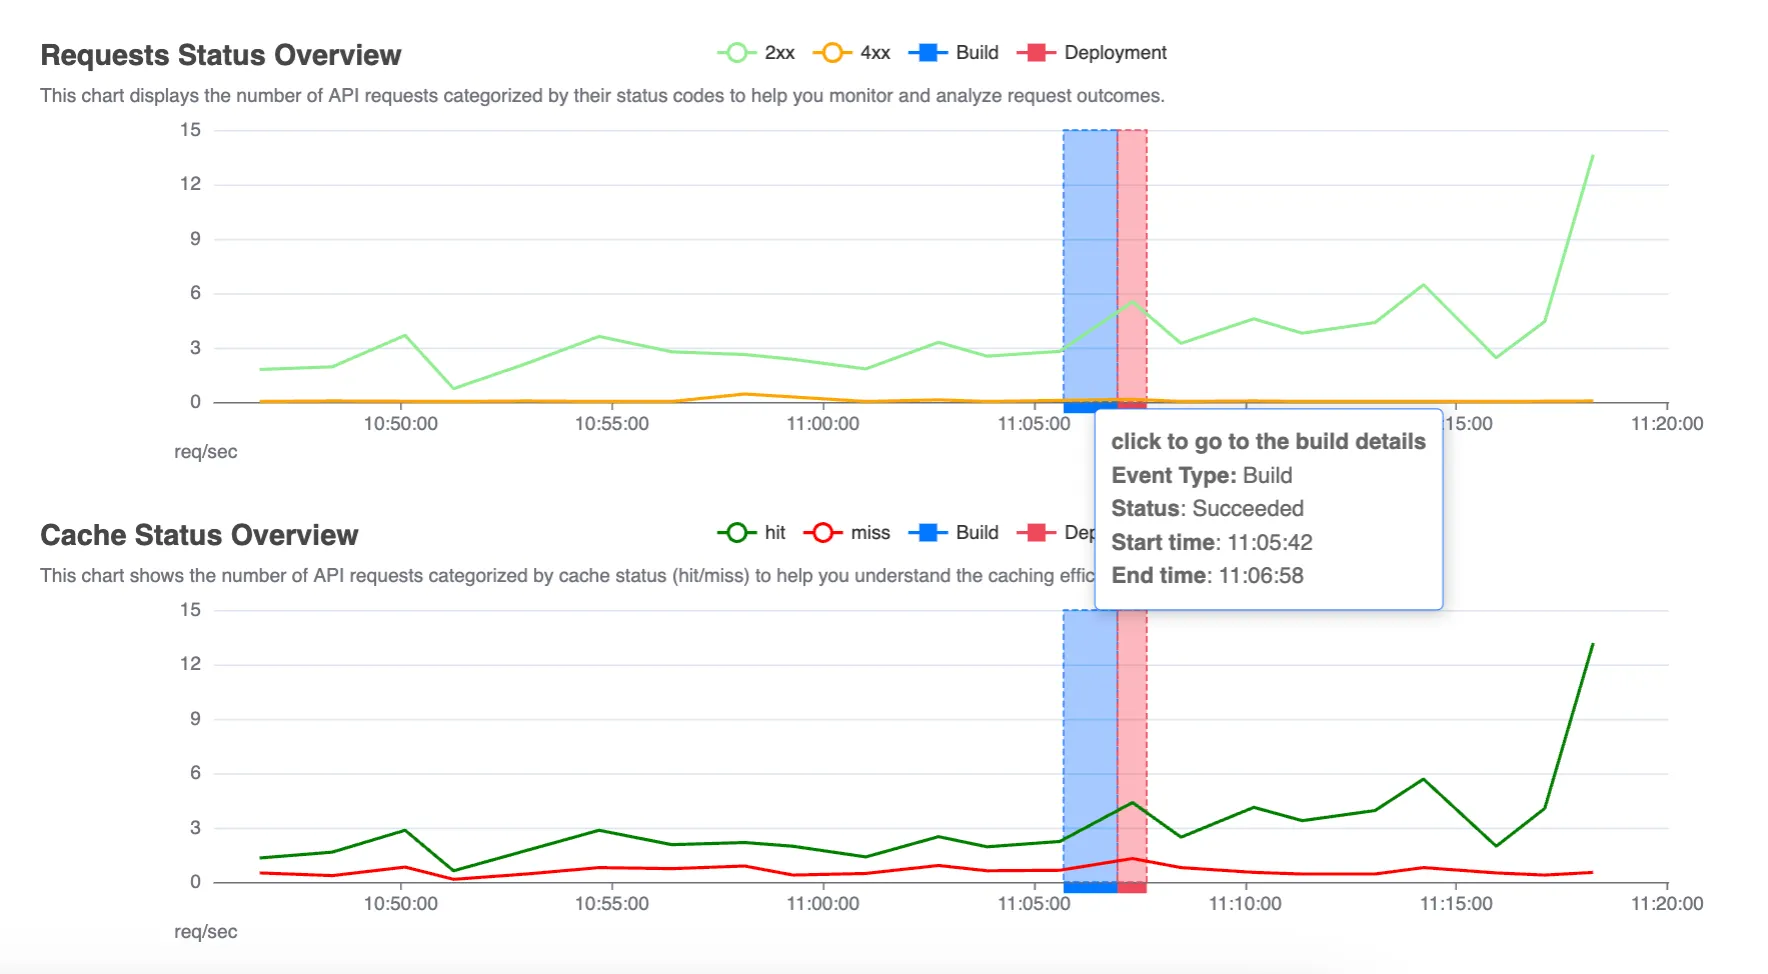
Build and deploy events
Section titled “Build and deploy events”The vertical markers provide contextual information about deployments of your front-end application.
Hover over these markers to see details and click on the horizontal axis to access the build details.
This can help correlate changes in request patterns with specific deployments or changes in your application.
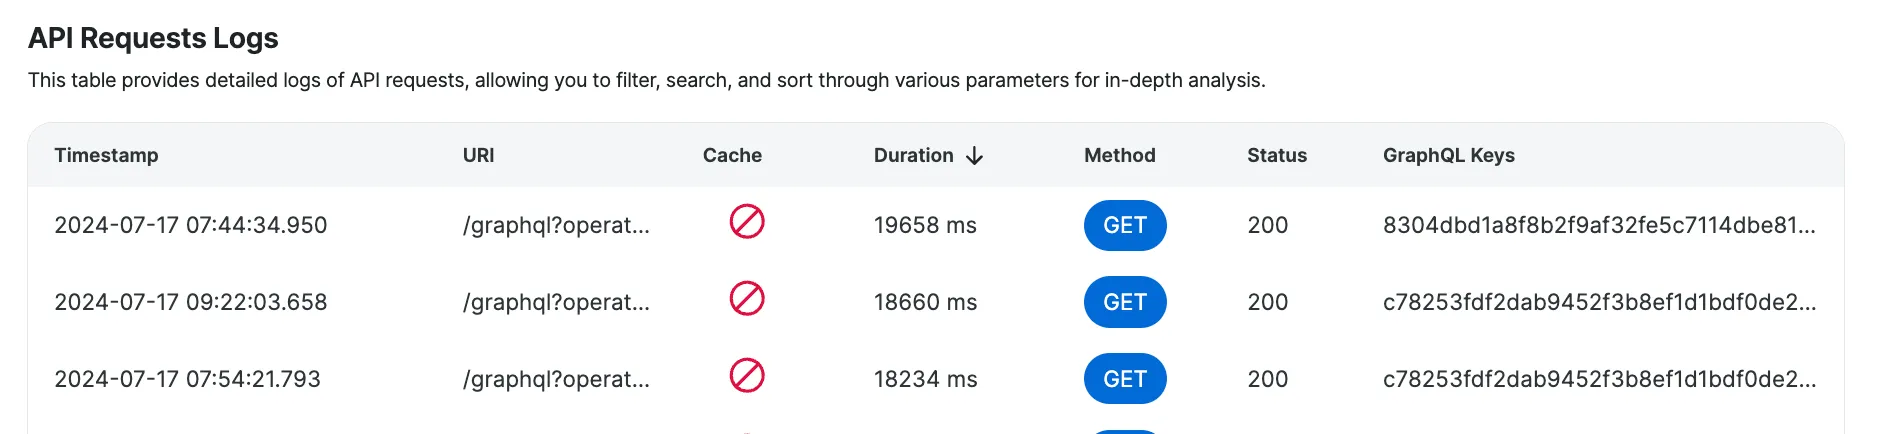
The request logs table provides detailed information about each API request made from your headless WordPress application to the WordPress backend.
This table complements the visual data presented in the charts by offering a granular view of each individual request.
Here’s a breakdown of each field included in the logs:
| Field | Description | Example |
|---|---|---|
Timestamp | The exact time when the request was made, in your local timezone. | 2024-06-27 13:33:28.278 |
URI | The specific resource requested through the API call. | /graphql?query=... |
Cache | A flag showing whether the request was served from the cache or directly from the server. | HIT |
Duration | The latency of the request in milliseconds. | 123 |
Method | The HTTP method used for the API request. | GET |
Status | Indicates the success or failure of the API request using the HTTP response status format. | 200 |
GraphQL Keys | A list of keys related to the query and response, detailing the types of content nodes queried and their individual node IDs. For more information on GraphQL Keys, visit the How to use GraphQL keys guide. | post:1234 page:5678 |
Using filters, search and sorting
Section titled “Using filters, search and sorting”You have several options for filtering and searching. You can filter by status group, cache status, and method, and you can search for specific URIs and GraphQL keys.
Additionally, you can use the time range picker at the top of the screen to select the desired time range, allowing you to request logs and insights from up to three days in the past.
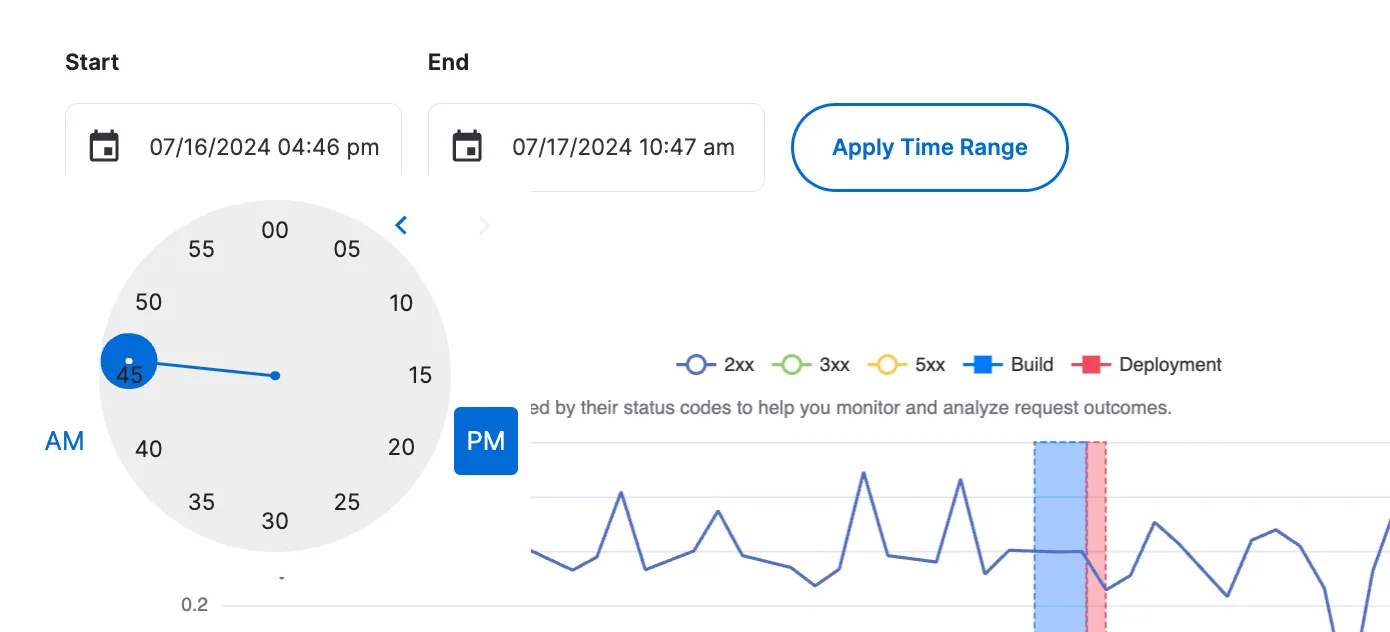
Select time range
Section titled “Select time range”The time range picker allows you to narrow down the logs to a specific period. This is useful for analyzing requests within a particular timeframe.
Use the time range picker at the top of the screen to select your desired time range.
Filtering
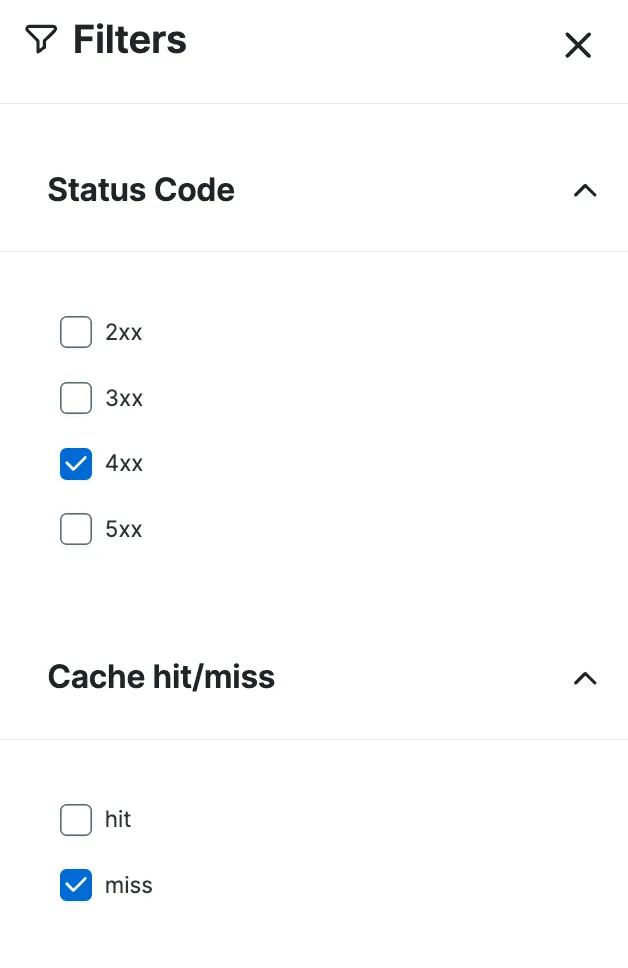
Section titled “Filtering”To filter the results, click on the Filter button on the right side of the dashboard. You can filter by the following parameters:
- Filter by status group: You can filter the logs based on the normalized status groups (2xx, 3xx, 4xx, 5xx). This helps in quickly identifying specific types of responses.
- Filter by cache status: This filter allows you to see requests that were served from the cache versus those served from the origin server.
- Filter by request method: You can filter the requests based on the HTTP method used (GET or POST).
To apply filters, select the filter criteria and hit the Apply filters button.
To remove filters, click on the Clear all string and hit the Apply filters button again.
Searching
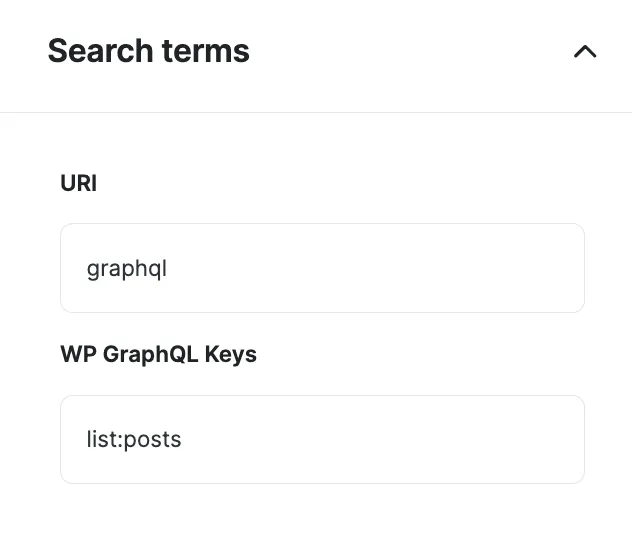
Section titled “Searching”To search for particular URI and GraphQL keys values, click on the Filter button on the right side of the dashboard. You can search through the following fields:
- Search by URI: This search option allows you to find specific API calls by entering the URI of the requested resource. Enter the URI or part of the URI into the search bar to find matching requests.
- Search by GraphQL keys: You can search for requests by GraphQL keys, which detail the types of content nodes queried and their individual node IDs. Enter the GraphQL key or part of the key into the search bar to locate relevant requests.
To search, specify the search criteria and hit the “Apply filters” button.
Sorting
Section titled “Sorting”To sort the results in the table, click on the name of the column you want to sort by. You can sort by the following parameters:
- Sort by duration: To find the requests that took the most (or the least) time to complete, click on the “Duration” field in the request details table.
- Sort by timestamp: To sort by the most recent (or the oldest) requests, click on the “Timestamp” field in the request details table.
Addressing problems
Section titled “Addressing problems”For ideas on improving your cache hit rate and minimizing errors from API calls, visit our Recommendations section.
How to use X-GraphQL-Keys
Section titled “How to use X-GraphQL-Keys”If you’re using GraphQL through the WPGraphQL plugin to retrieve data from WordPress, analyzing the X-GraphQL-Keys can help you understand the vulnerable spots of your caching strategy.
When WPGraphQL returns a response, this response includes an X-GraphQL-Keys header.
This header provides a list of keys relevant to both the query and the response, detailing the types of nodes queried and their individual node IDs.
Content of the X-GraphQL-Keys header
Section titled “Content of the X-GraphQL-Keys header”036be9fac3f0c0d118ca194610792b782cce0419f8df07381b764dd01228f331graphql:Queryoperation:SearchResultslist:postslist:mediaitemlist:profilecG9zdDo3MTg0NA==cG9zdDo2Nzc3Ng==cG9zdDo2MzU1Mw==cG9zdDo2MjIyMQ==cG9zdDo1OTU5NA==Let’s dig deeper into what each of these elements stands for:
036be9fac3f0c0d118ca194610792b782cce0419f8df07381b764dd01228f331is the hash of the query,graphql:Queryis the operation type,operation:SearchResultsis the operation name,list:xxxxxshows the name of the resource that was requested in query (for example,list:postsidentifies the query asked for a list of posts),- ID such as
cG9zdDo3MTg0NAis a base-64 encoded ID of the node that was resolved. Every object in WordPress is treated as an individual ”node” in GraphQL - posts are nodes, pages are nodes, categories, tags, users, comments, menu items, etc. are all considered “nodes”. For more information on nodes visit this documentation.
Connecting GraphQL Keys with cache purge logs
Section titled “Connecting GraphQL Keys with cache purge logs”WP Engine, through WPGraphQL, uses these keys to “tag” the cached document.
WPGraphQL Smart Cache monitors for publish, update, and delete events in WordPress, and triggers a graphql_purge action to clear caches associated with the modified object.
The cache eviction strategy is as follows:
- For publishing:
purge(list:$type_being_published) - For updates:
purge($id_of_node_being_updated) - For deletions:
purge($id_of_node_being_deleted)
This method offers a more refined approach than merely purging caches based on general actions like save_post.
When cache for the corresponding tag is evicted, the cached document is also purged.
If you’re experiencing a low cache hit rate, it can be beneficial to review both the GraphQL keys of your requests and the cache purge events.
Using GraphQL keys for troubleshooting
Section titled “Using GraphQL keys for troubleshooting”While at the moment the process is very manual, here’s how you can evaluate the reasons for a low cache hit rate of your GraphQL requests:
When troubleshooting a low cache hit rate, start by examining the GraphQL keys associated with your requests. These keys provide insights into what data is being queried and how it is tagged for caching. Additionally, reviewing cache purge events can help you understand when and why cached data is being invalidated. This combined analysis can uncover patterns or specific issues contributing to the low cache hit rate.
To gain visibility into cache purge events, you need to enable logging in the WPGraphQL Smart Cache settings. Follow these steps to turn on logging:
- Navigate to your WordPress admin dashboard.
- Go to
WPGraphQL→Settings→Cache. - Check the
Log Purge eventscheckbox.
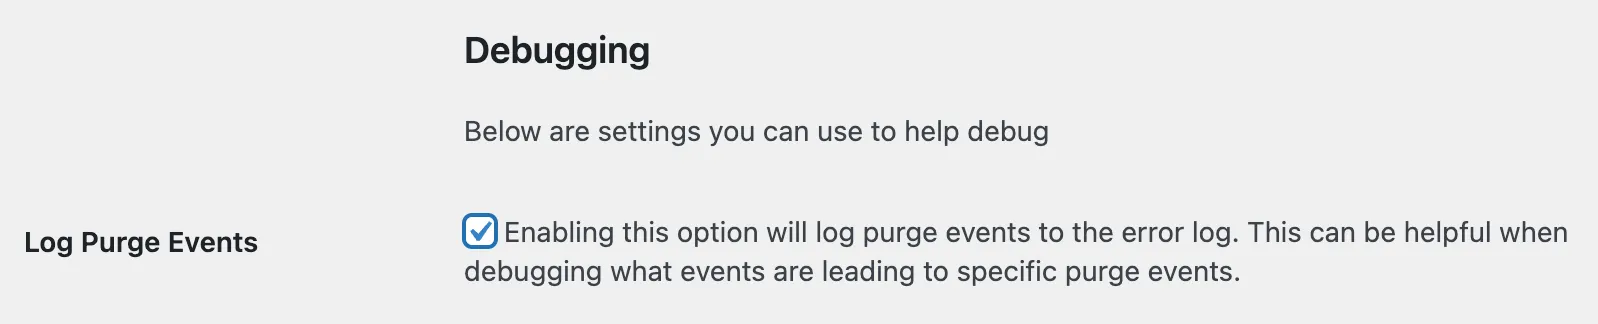
By enabling this setting, you’ll start logging all cache eviction events, which will be crucial for your analysis.
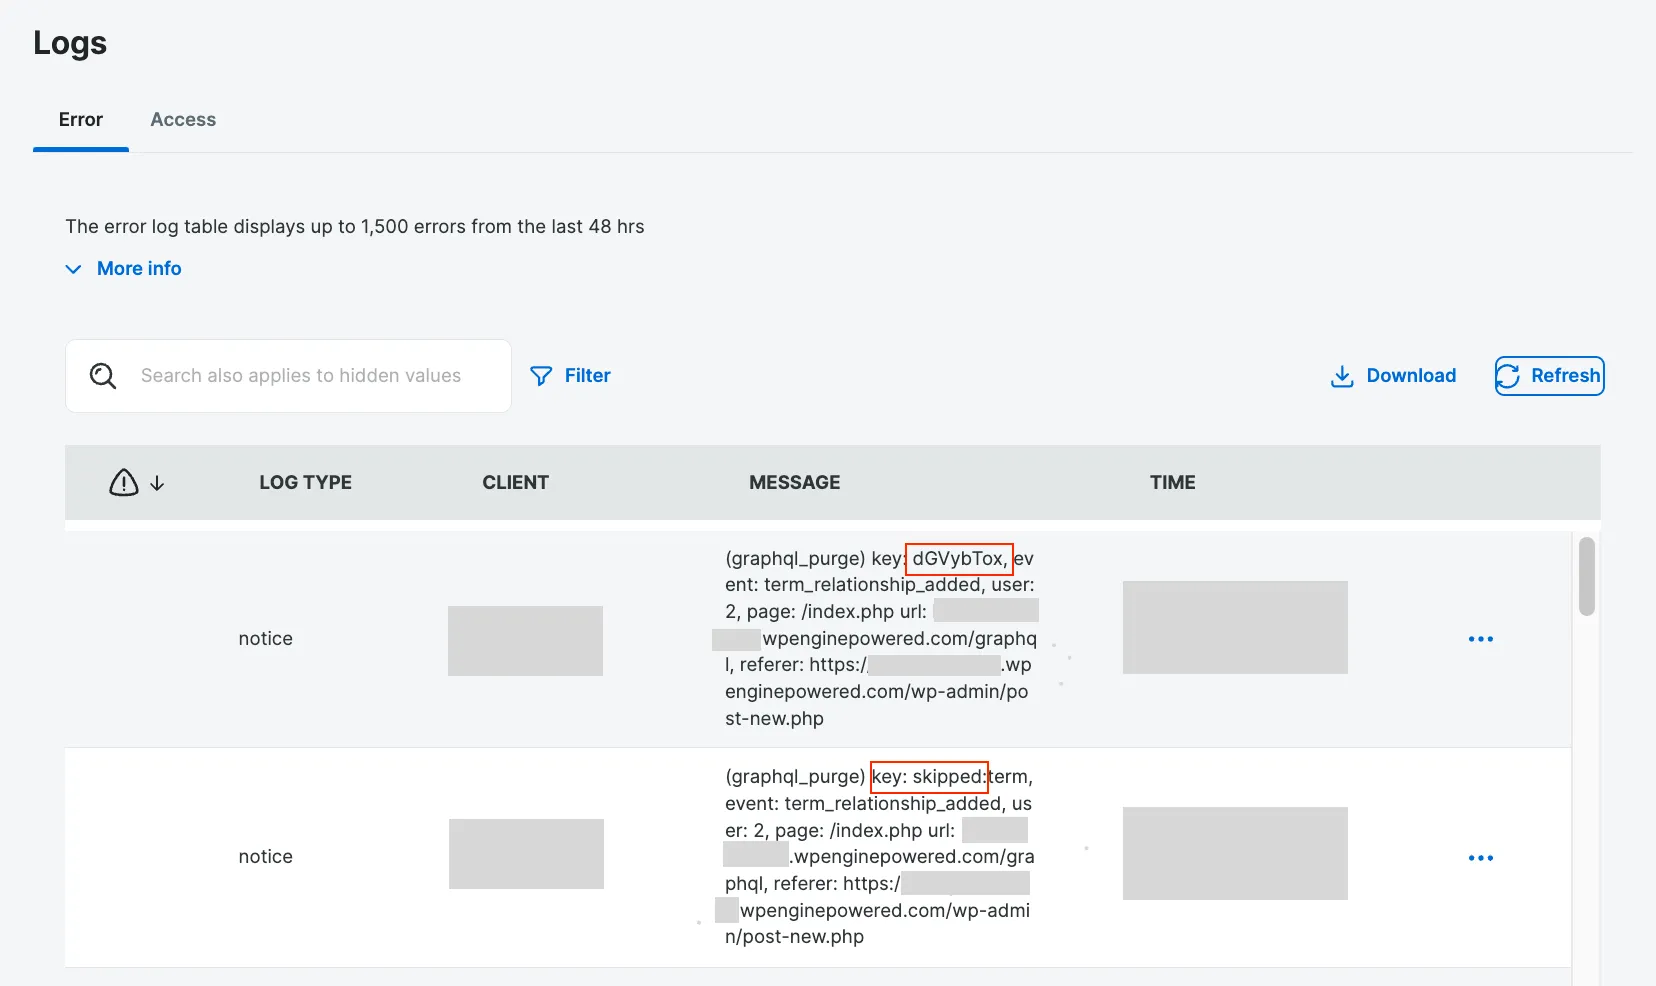
These logs will show detailed information about each cache purge event, including the type of event (publish, update, delete) and the specific GraphQL keys involved. Reviewing these logs will help you identify patterns and potential issues with your caching strategy.
Once logging is enabled, you can review the recorded cache purge events. This information is accessible through the WP Engine user portal. Here’s how to find and review these events: 1. Log in to your WP Engine user portal. 2. Navigate to your WordPress install overview. 3. Go to the Logs section. 4. Select Error Logs to view the cache purge events.
Each log starts with the (graphql_purge) string and contains information detailed information about the event.
Limitations
Section titled “Limitations”While our tool provides valuable insights into the API interactions of your headless WordPress application, it is still in the alpha phase and comes with a number of limitations:
- Only server-side requests are detected: Our tool currently detects and analyzes server-side requests only. Client-side requests (e.g., those made using the
useEffecthook in React applications) are not detected or registered. - Limited visibility into POST requests: Although our tool logs details of POST requests such as URI and status code, it does not capture the request body. This may hinder diagnosing issues related to the data sent in POST requests.
- Data continuity: As the current solution is in alpha, we cannot guarantee data continuity. Some data might be missing or incomplete.
- Connected WordPress: We assume your front-end application is making requests to the WordPress install linked to your Headless Platform environment. Verify this connection in your environment overview screen under “Linked WordPress environment.”
- Advanced Network required: Your WordPress install must use the Advanced Network to collect logs. Ensure you are using the Advanced Network URL as the URL of your WordPress install. Additionally, the requests are not collected if you’re using WP Engine’s GES (Global Edge Security) with your WordPress back-end.