Runtime logs
What are runtime logs?
Section titled “What are runtime logs?”Runtime logs capture a wide range of information generated by your Node.js application during its execution. These logs provide insights into the real-time operations and performance of your application.
They include, but are not limited to:
- System events: Information about the starting, stopping, and restarting of your application.
- Application errors: Detailed error messages and stack traces that help diagnose issues within your application code.
- Custom log messages: Any custom logging implemented within your application to track specific actions or events.
Analyzing runtime logs helps you identify and resolve bugs or issues in the code, ensuring the application runs as expected.
Log rate limits
Section titled “Log rate limits”Runtime logs are automatically rate-limited to 350 logs per second per deployment to maintain system performance and reliability. If your application generates logs faster than this rate, excess logs will be dropped and won’t appear in the log viewer.
Best practices to avoid hitting rate limits:
- Use appropriate log levels (avoid excessive debug logging in production)
- Implement log sampling for high-frequency events
- Batch related log messages when possible
Interacting with runtime logs
Section titled “Interacting with runtime logs”To access and review your runtime logs, follow these steps:
- Navigate to the
Logstab: Go to theLogstab within your app environment screen. - Select the time period: In the
Runtime logssection, specify the time period for which you want to review the logs.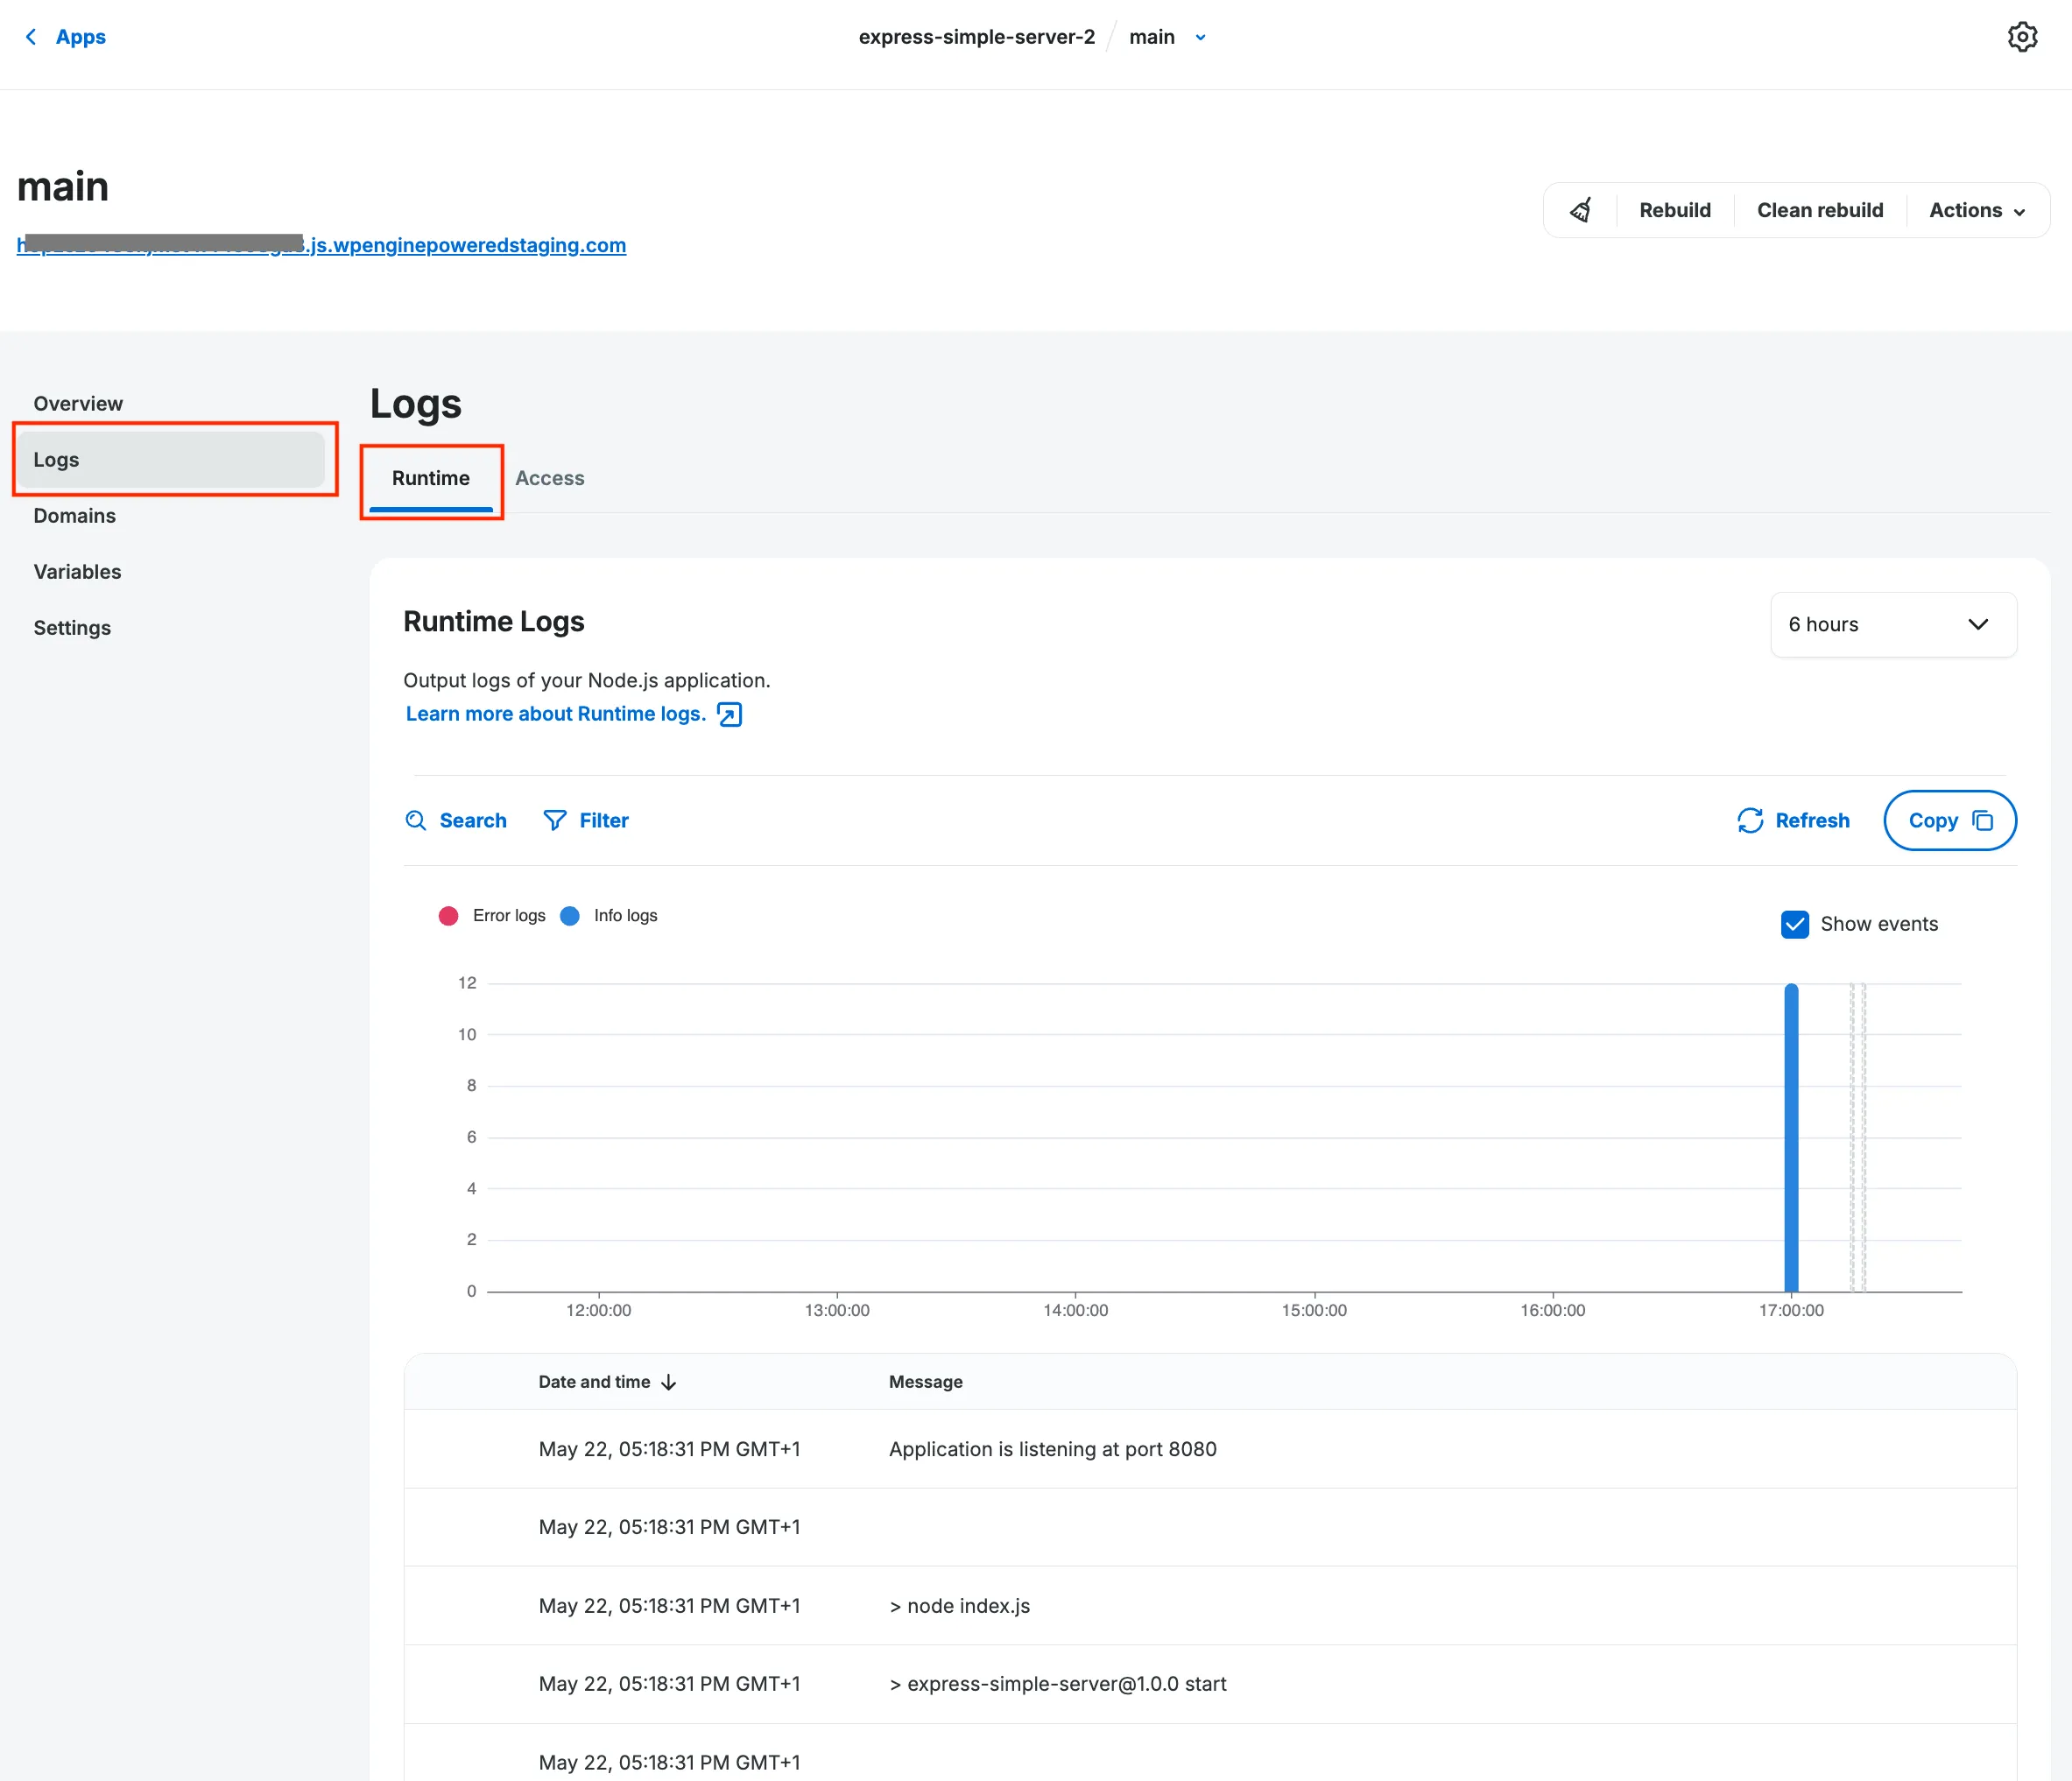
Log chart
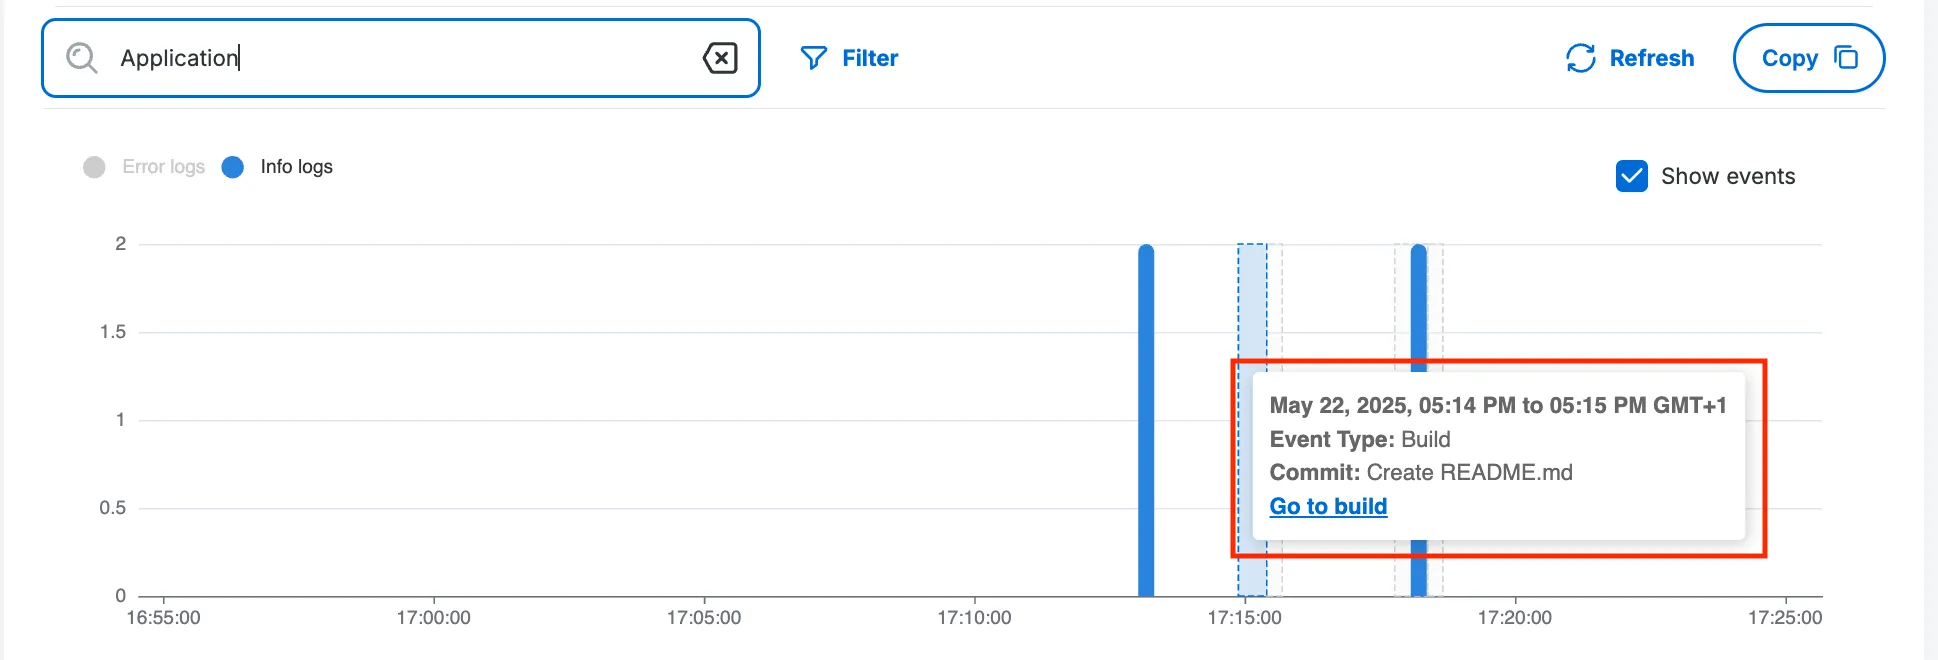
Section titled “Log chart”The log chart provides a visual representation of your app’s log activity over time:
- Color-coded entries: Info logs and error logs are displayed in different colors for quick identification.
- Deployment markers: Vertical lines on the chart indicate when deployments
occurred, allowing you to correlate code changes with log patterns. Hover over
deployment markers to view details and access links to deployment information.
Filtering
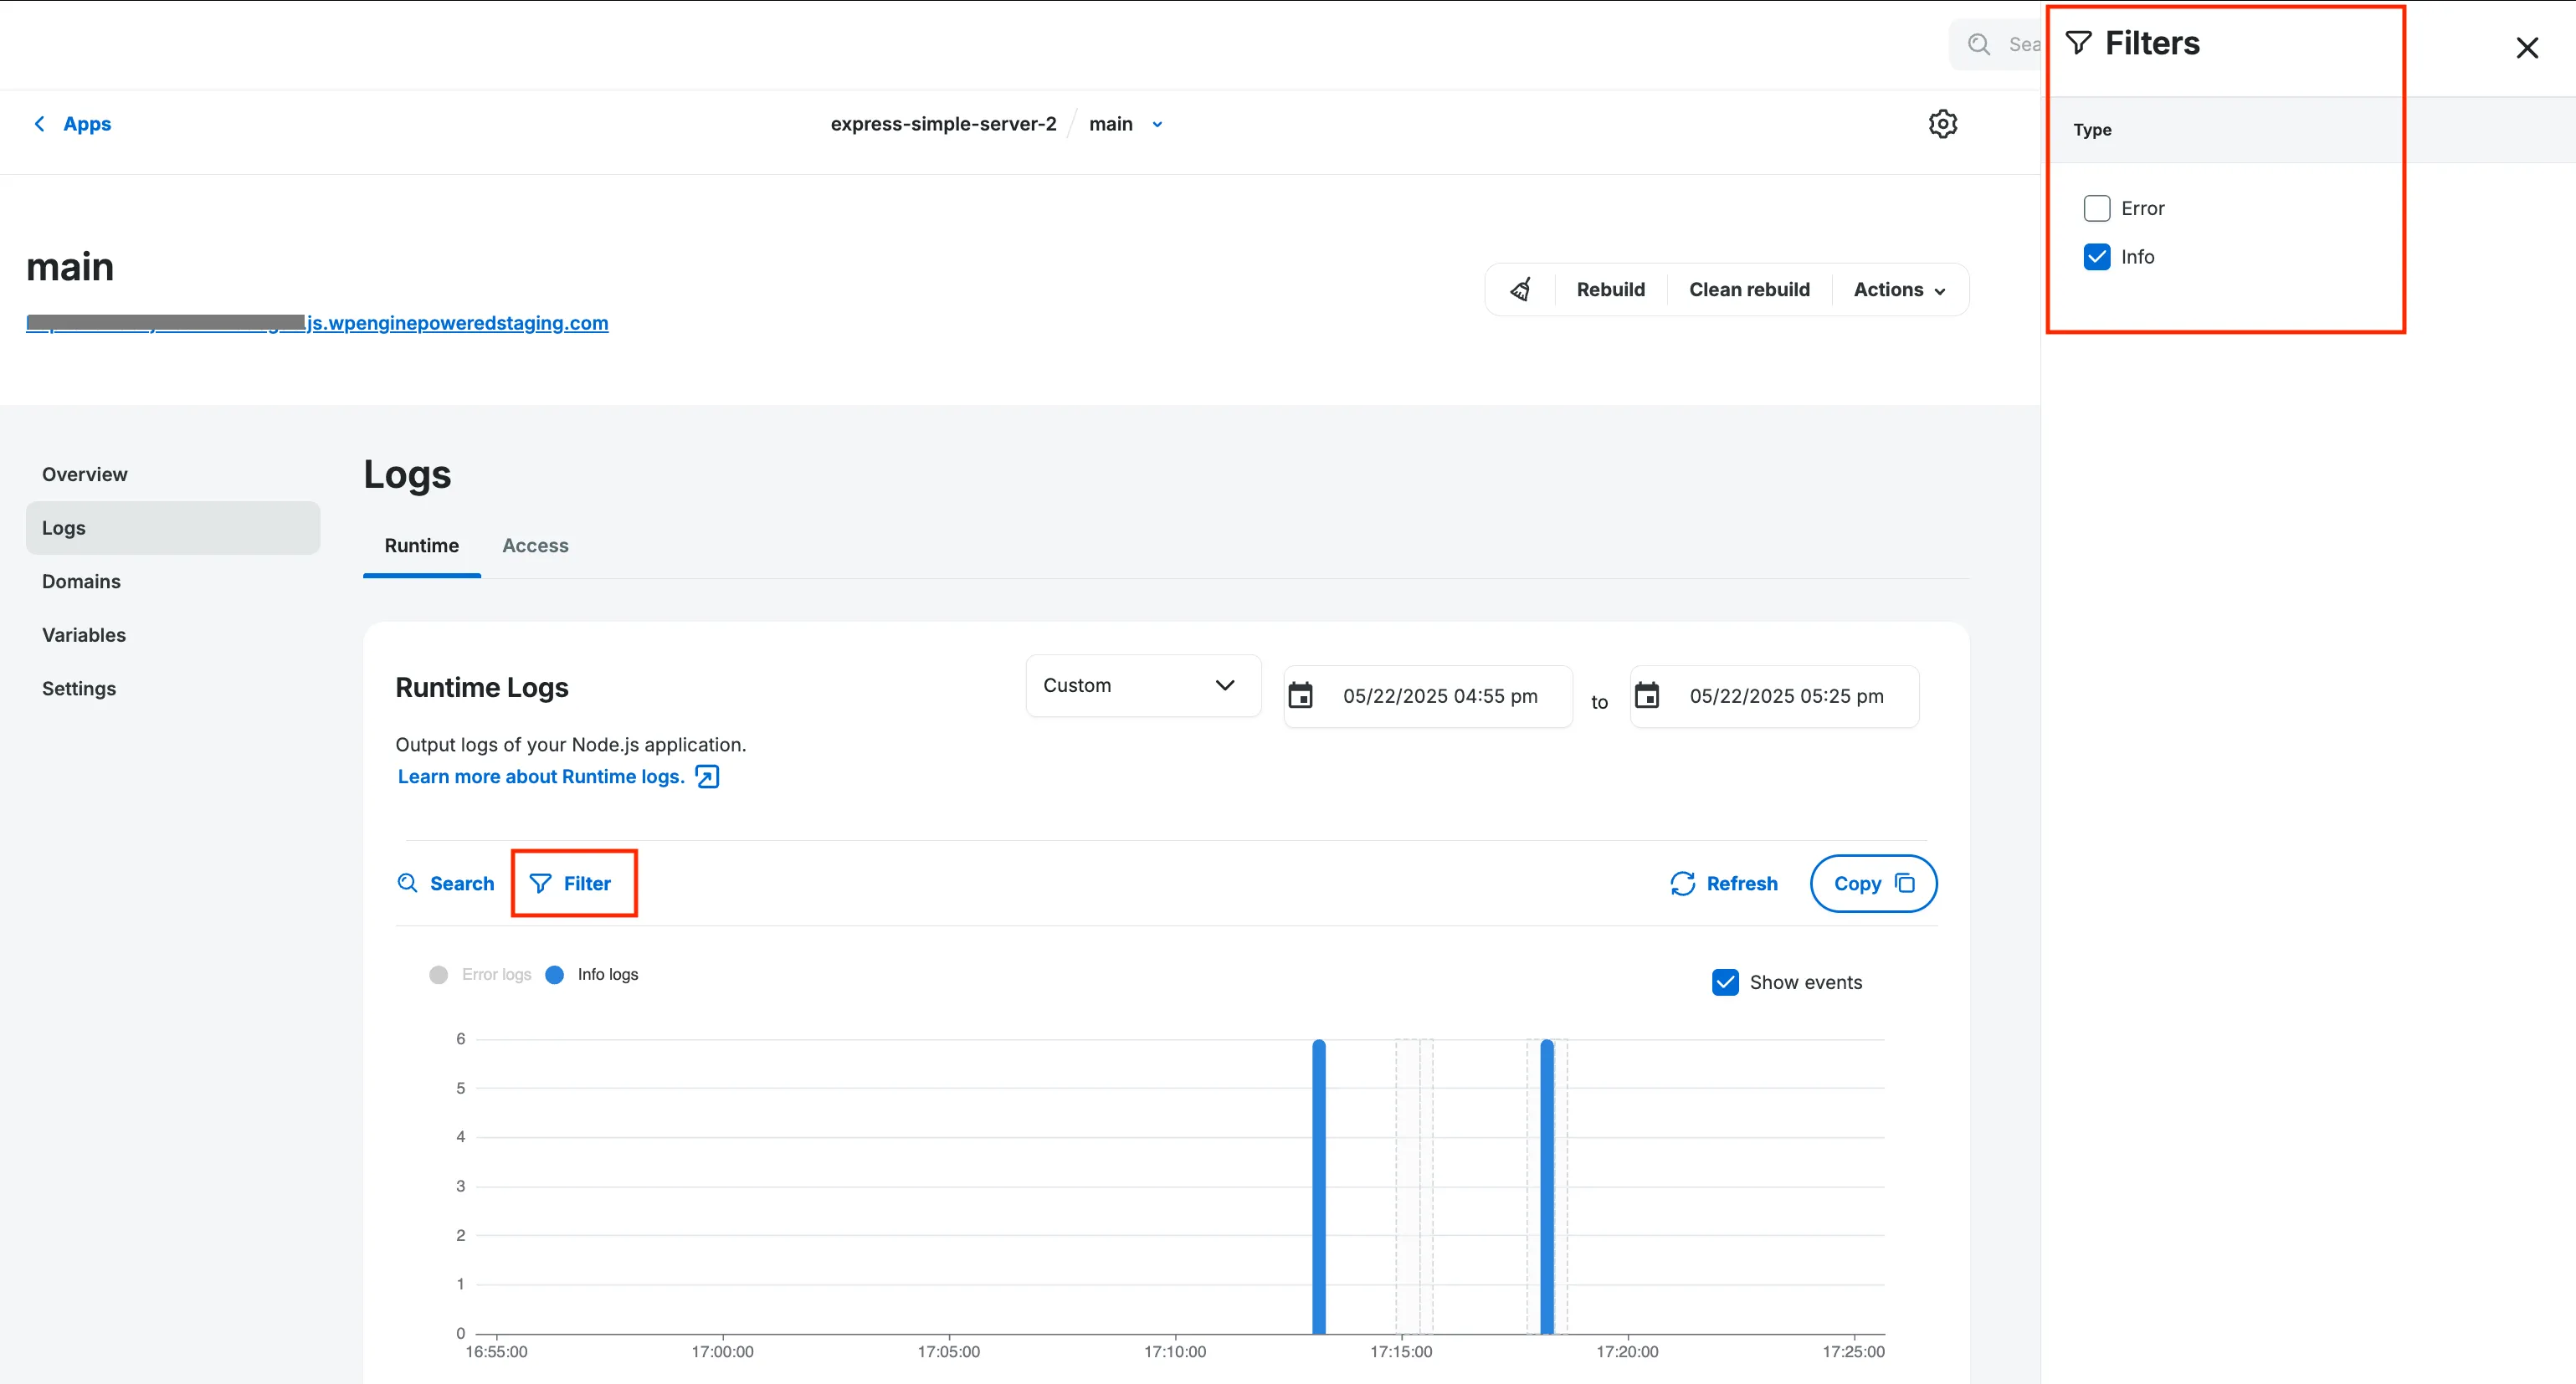
Section titled “Filtering”To streamline your debugging process, you can easily filter your runtime logs:
- Find the
Filterbutton above the log table. - Choose one of the following options:
Errors: Shows only error logsInfo: Displays only stdout logs
Full-text search
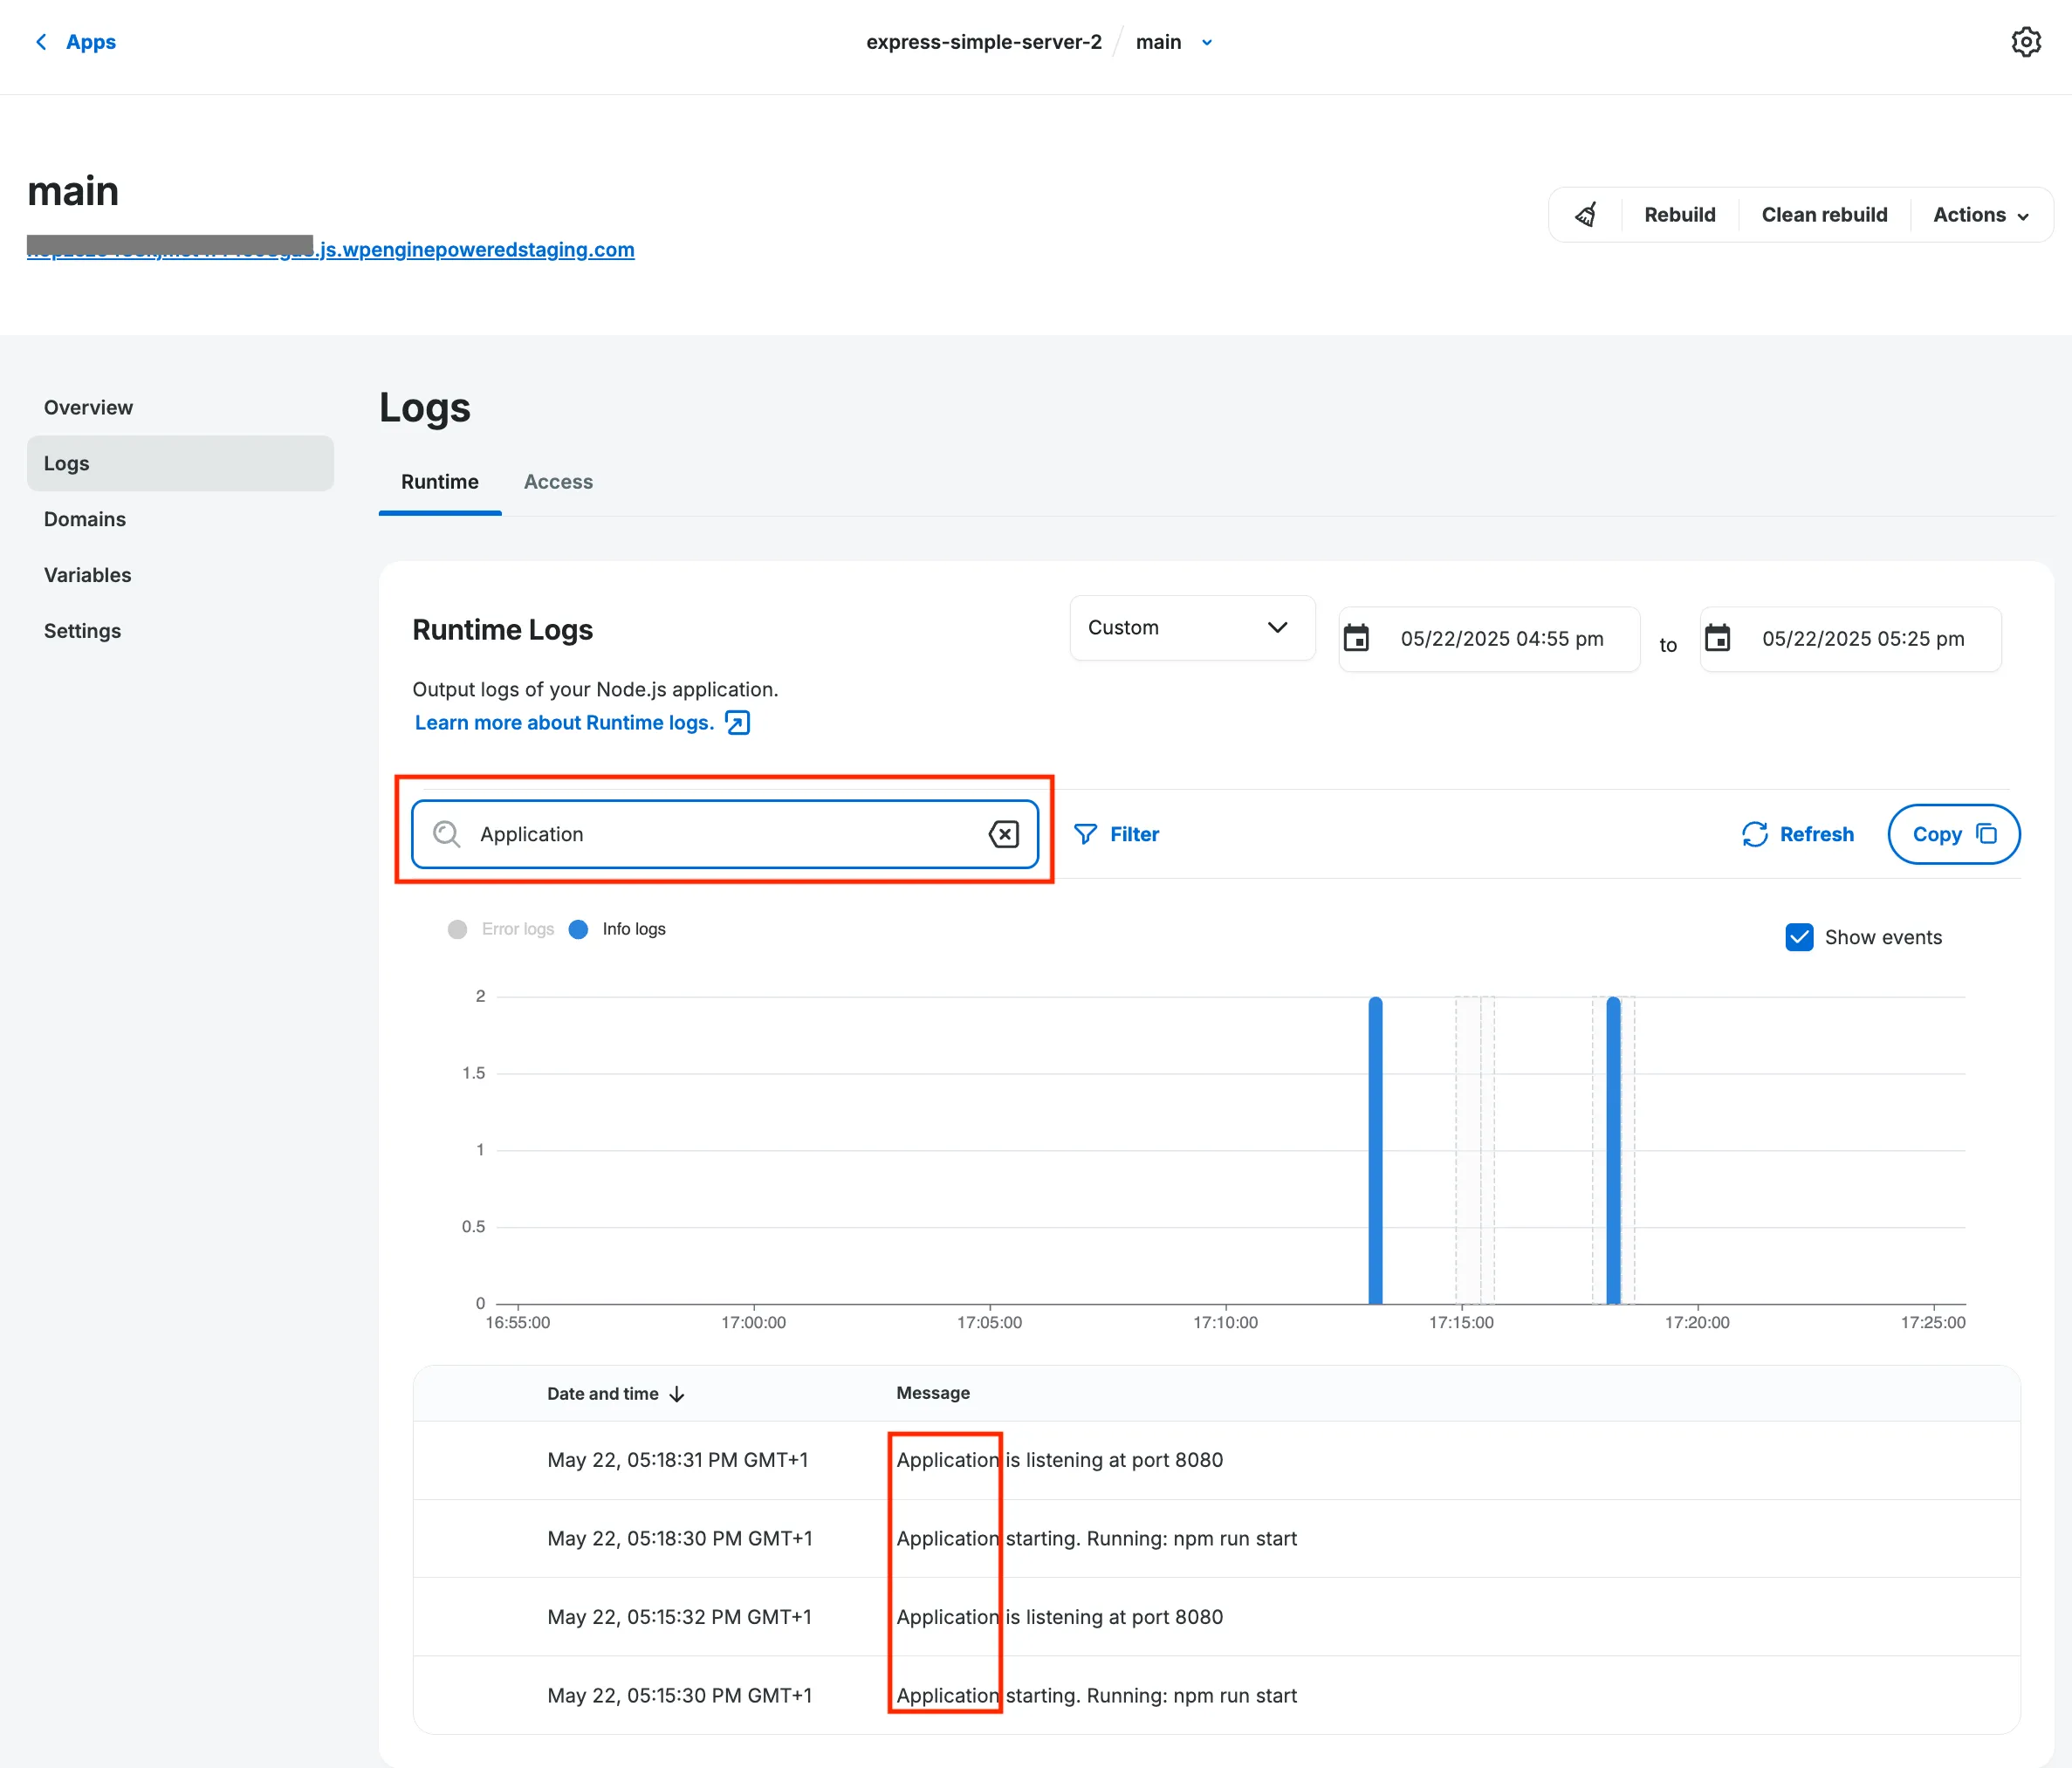
Section titled “Full-text search”Quickly pinpoint specific issues or events in your logs with our full-text search feature:
- Locate the search bar above the log table,
- Enter any relevant term, error message, or code snippet,
- Hit
Enterto confirm.
The log table will instantly filter to show only matching entries.
Time-based log filtering
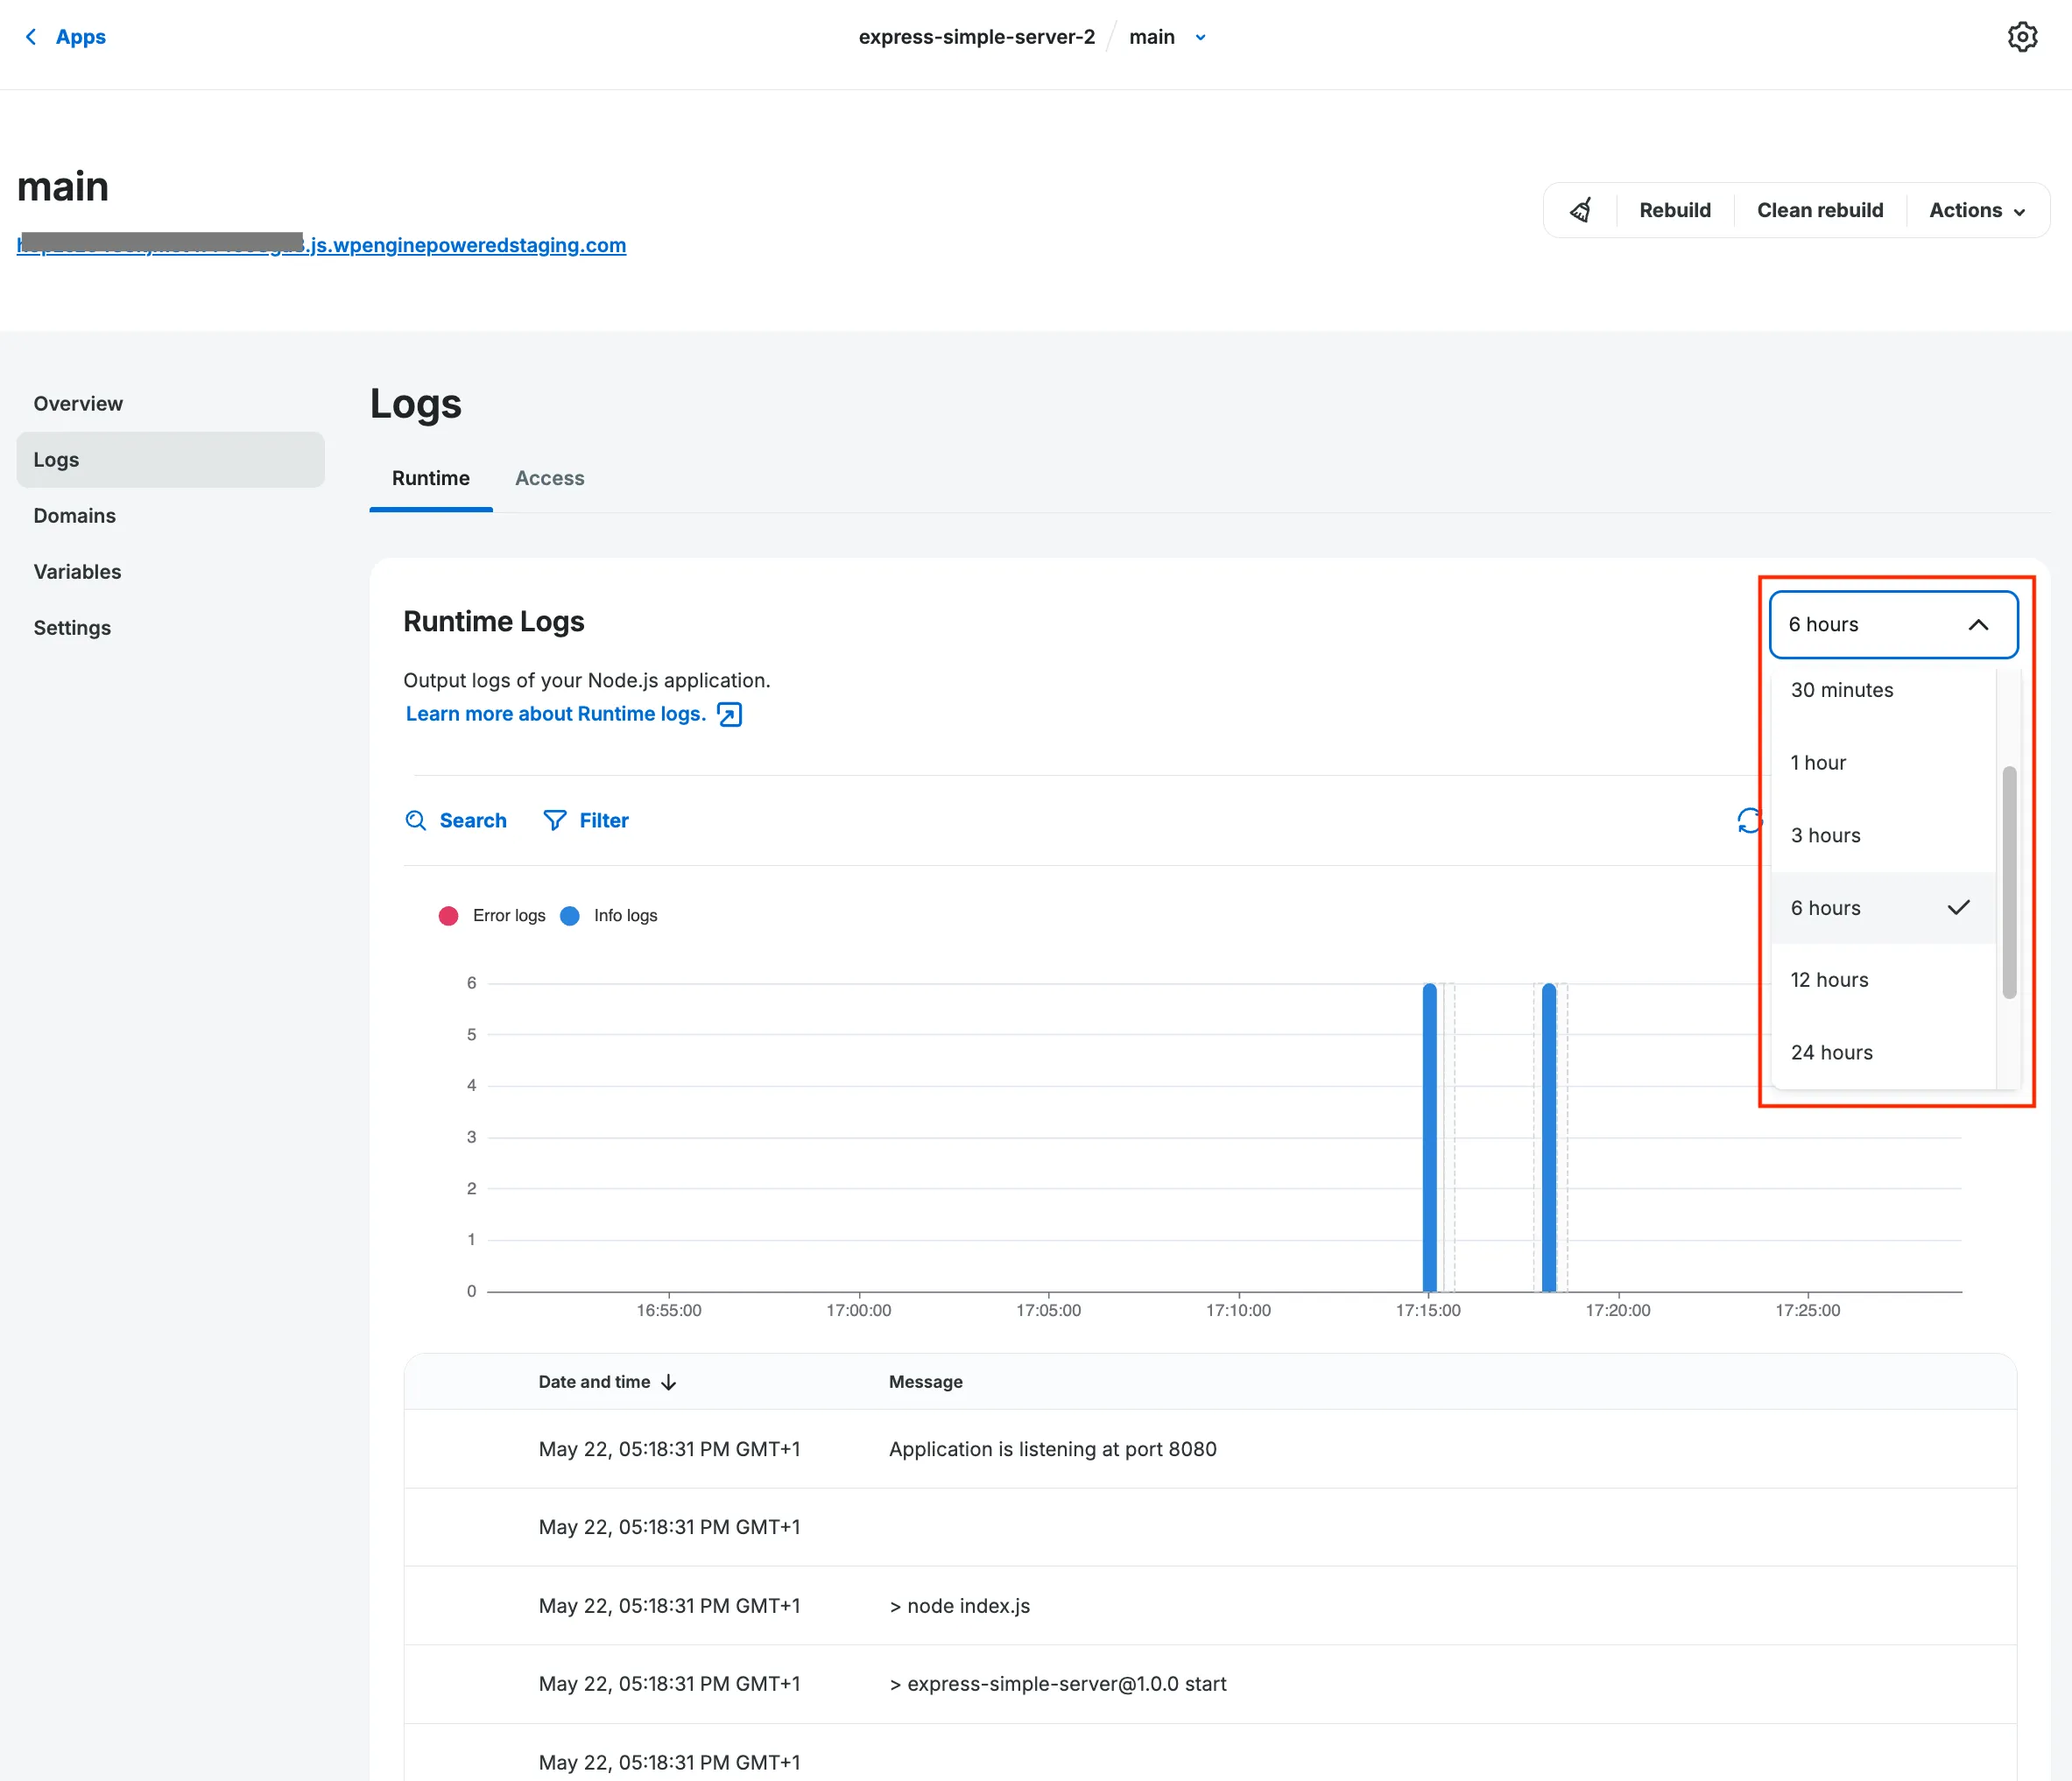
Section titled “Time-based log filtering”To narrow down your log analysis to specific time windows, find the time selector dropdown near the top of the log viewer and choose from pre-defined time windows:
- 1 minute
- 5 minutes
- 30 minutes
- 1 hour
- 6 hours
- 12 hours
- 24 hours
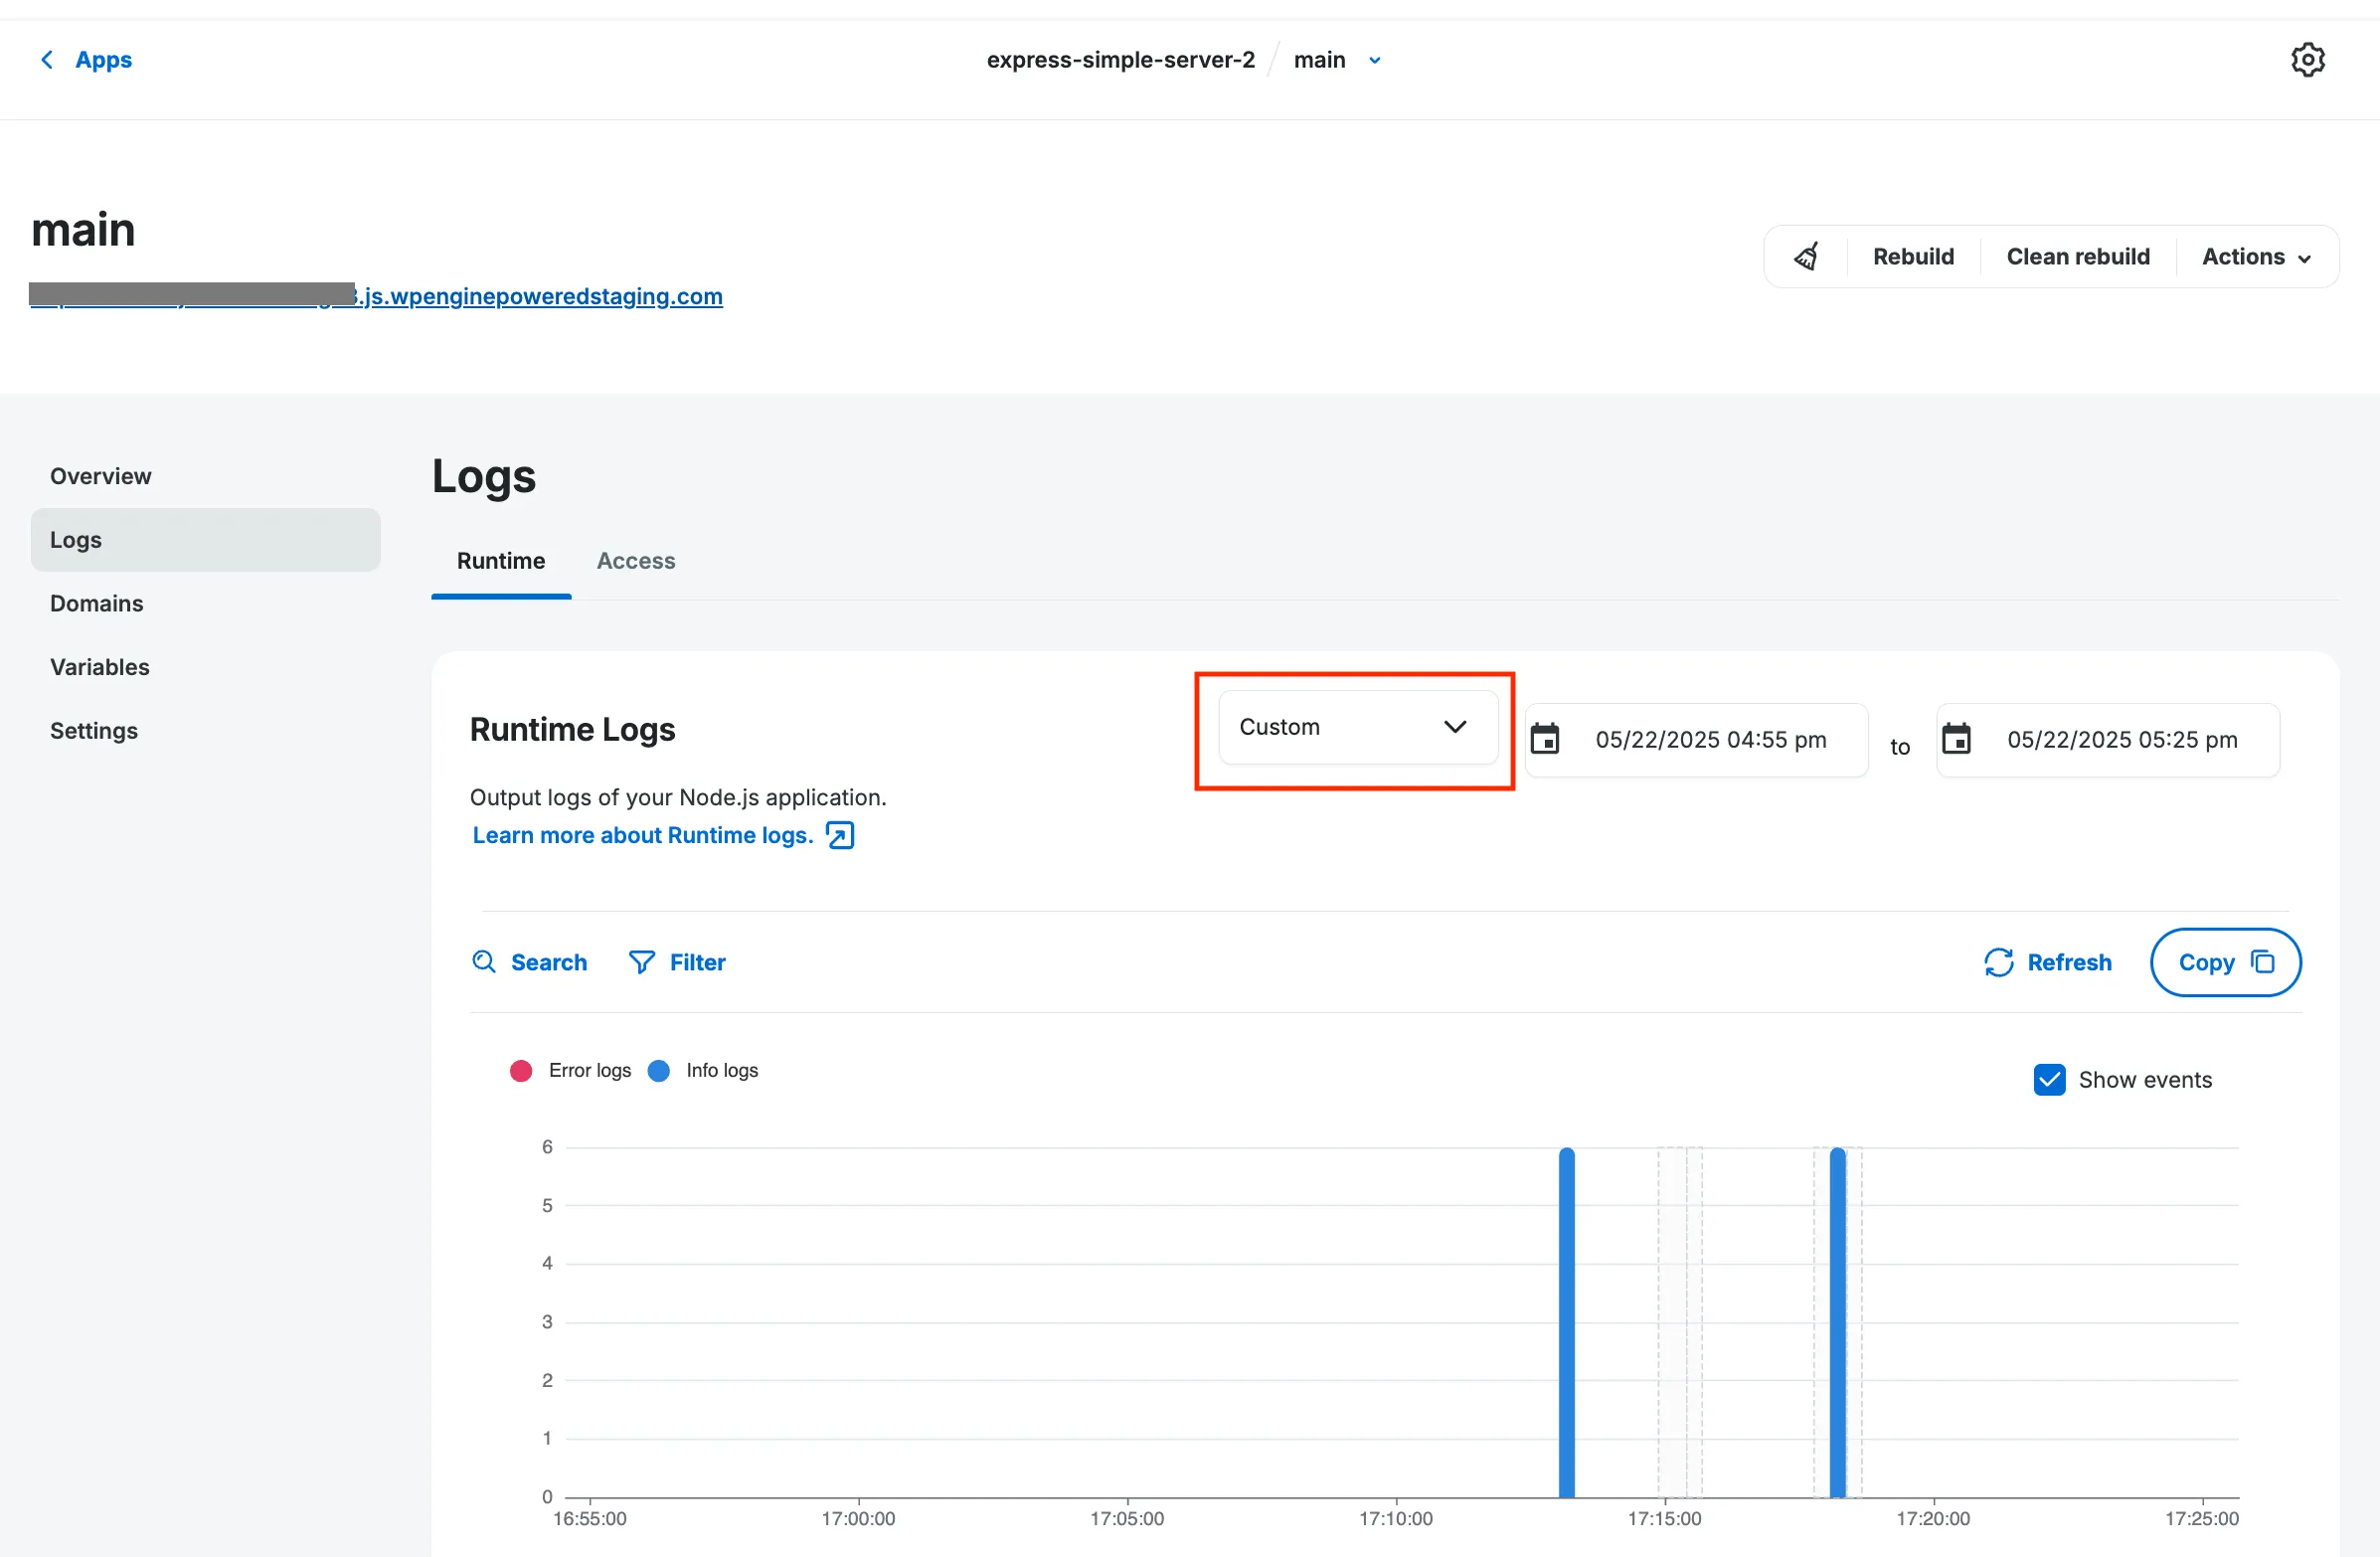
You can also select a custom length of the time window you want to review by
clicking on “Custom” option in the dropdown. Additionally, you can request logs
that appeared since the last build of your environment, as long as it happened
no longer than 24 hours ago.
Additionally, you can filter your logs visually by selecting a time frame on
the chart, like it’s shown below:
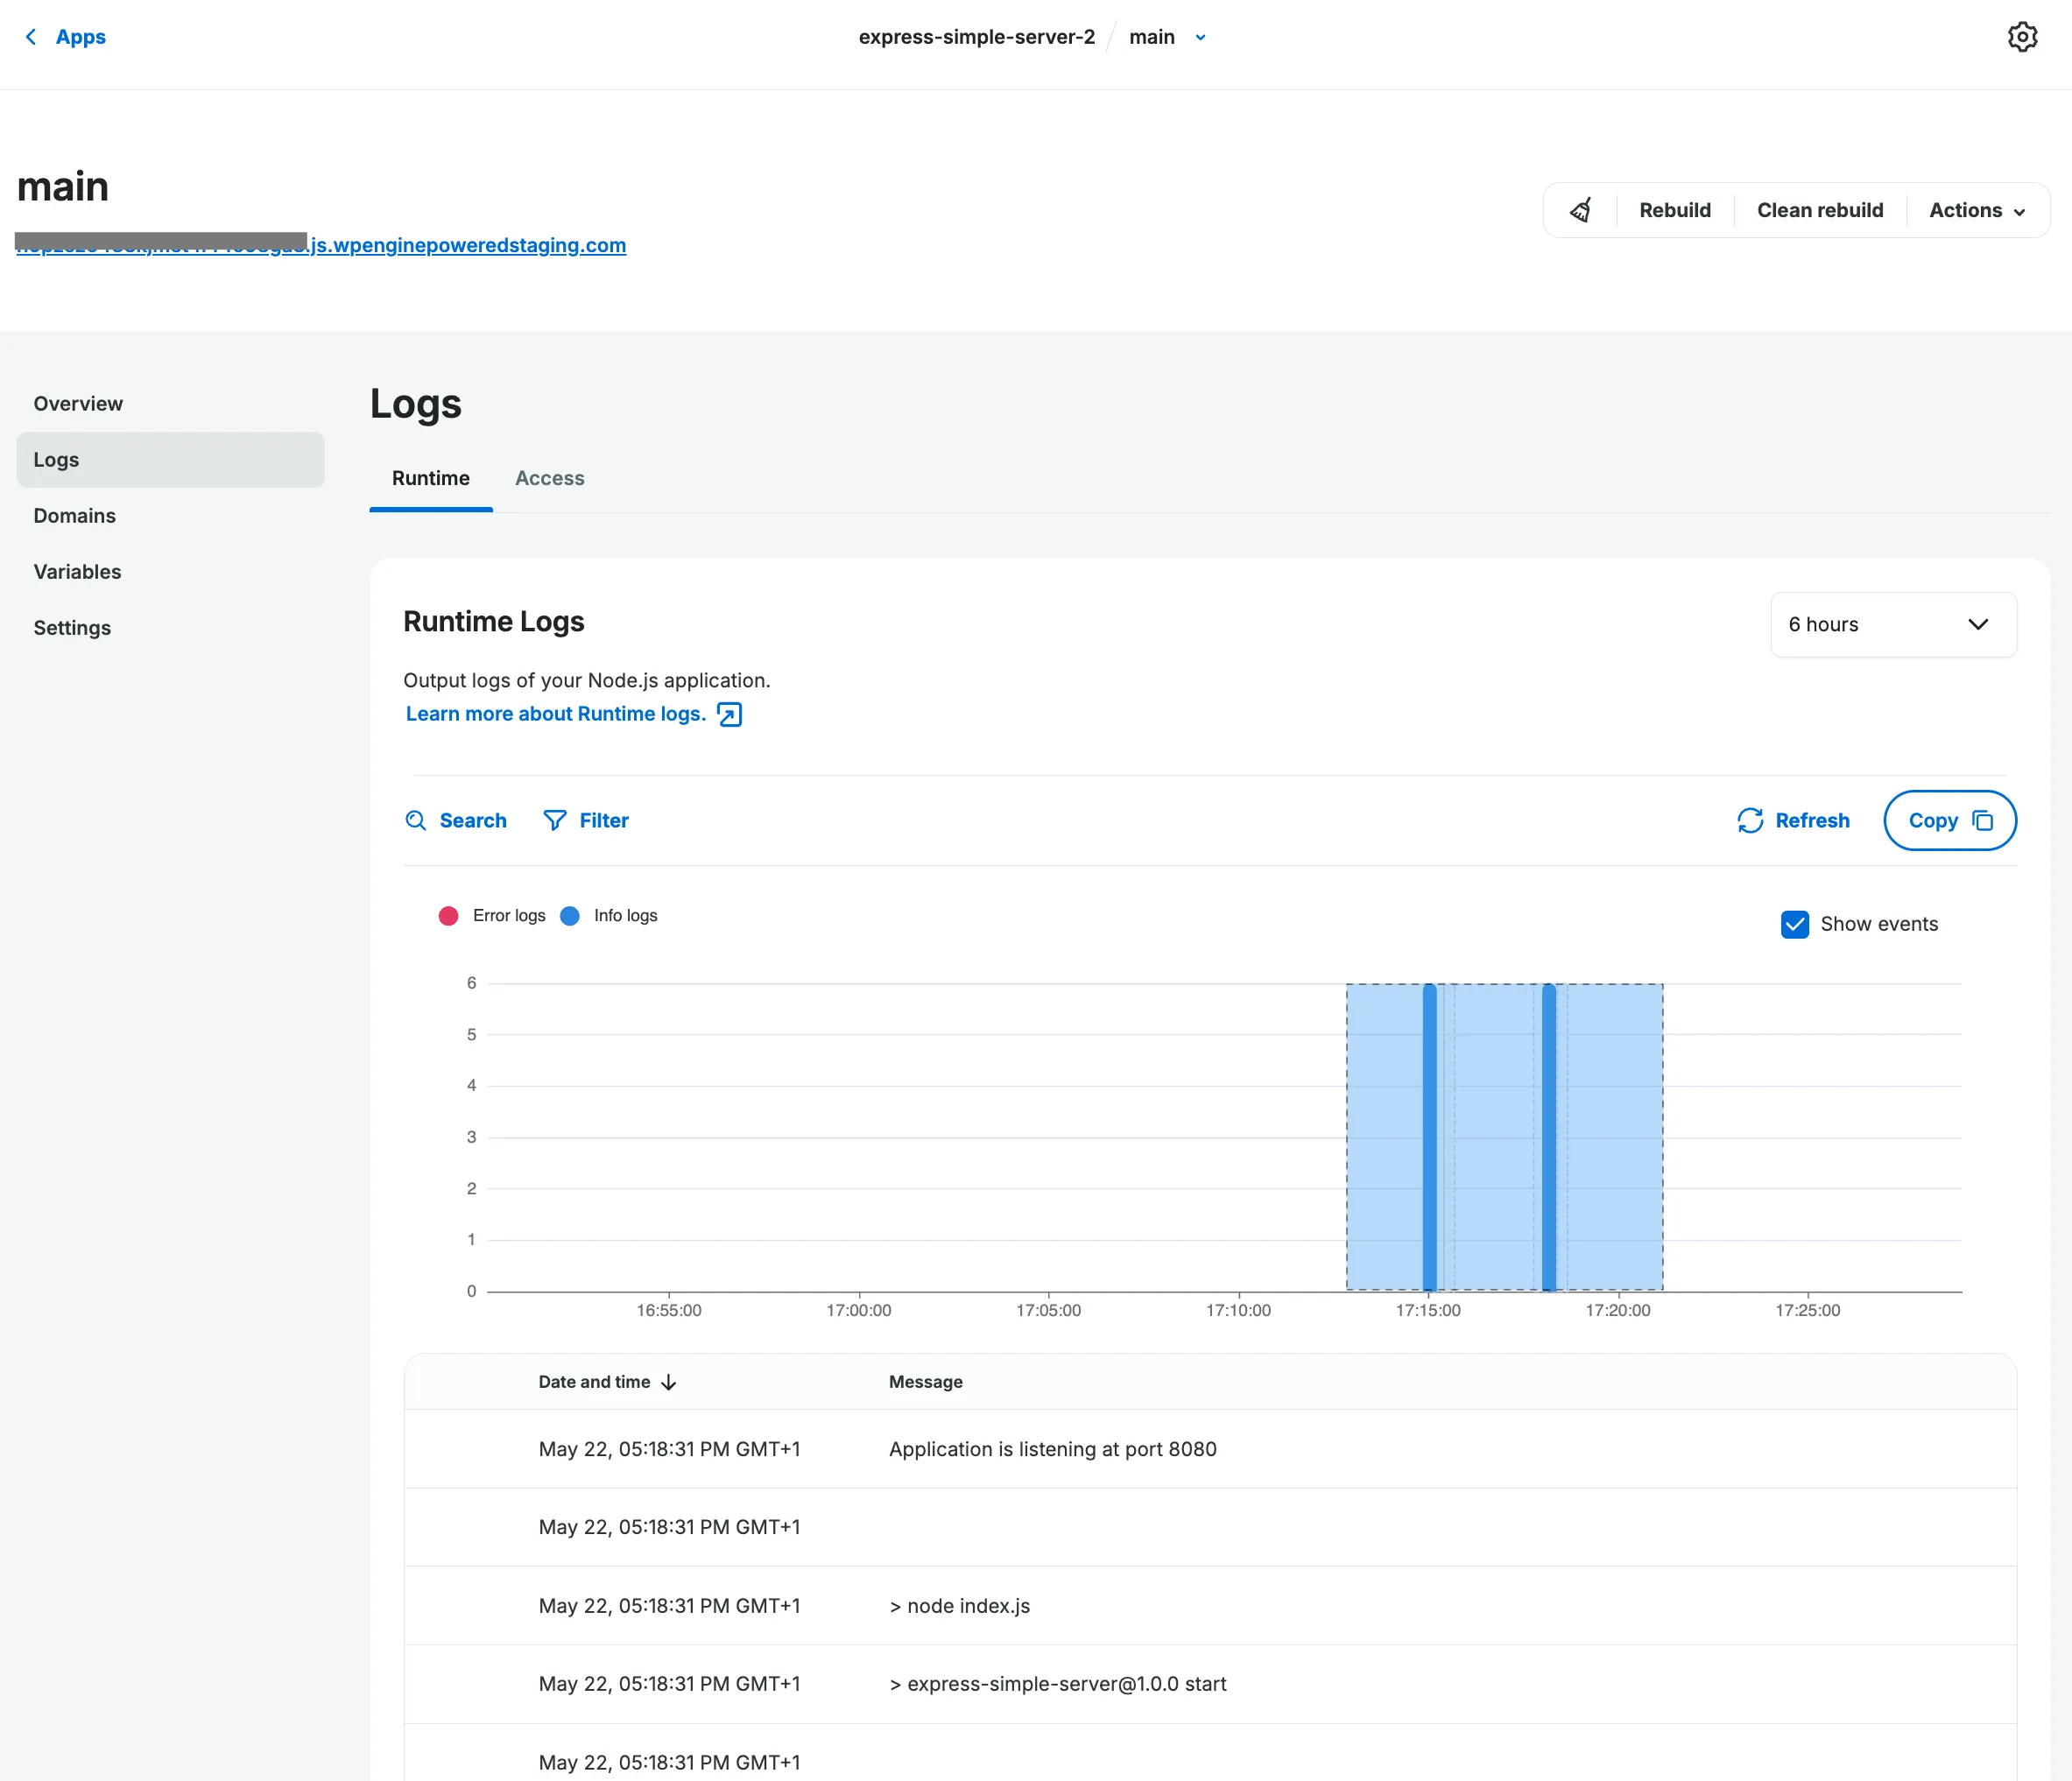
The log view instantly updates to show only entries within the selected timeframe.